
Welcome to the new Traders Laboratory! Please bear with us as we finish the migration over the next few days. If you find any issues, want to leave feedback, get in touch with us, or offer suggestions please post to the Support forum here.


Simple trader
-
Content Count
23 -
Joined
-
Last visited
Posts posted by Simple trader
-
-
Sorry, may be I did not make myself clear. I meant what market of the SPY are you using for your SPY chart? When I try to open an SPY (on my broker platform), I get a list of SPY markets - stock, futures, options, cfd etc. So which one do I choose to open? ThanksNever had such problem. Just open SPY in Yahoo finance or Finviz - it is SPY that I am using;)
-
Many thanks for the response Simple trader. Just one more question, which SPY market do you use, the stock, futures or option? Thank youI am trading US stocks only.
-
Simple trader, I have got some questions if you do not mind:1) The SPY you are using, is this SPDR S&P 500 ETF Trust?
2) What time frame of the SPY are you using?
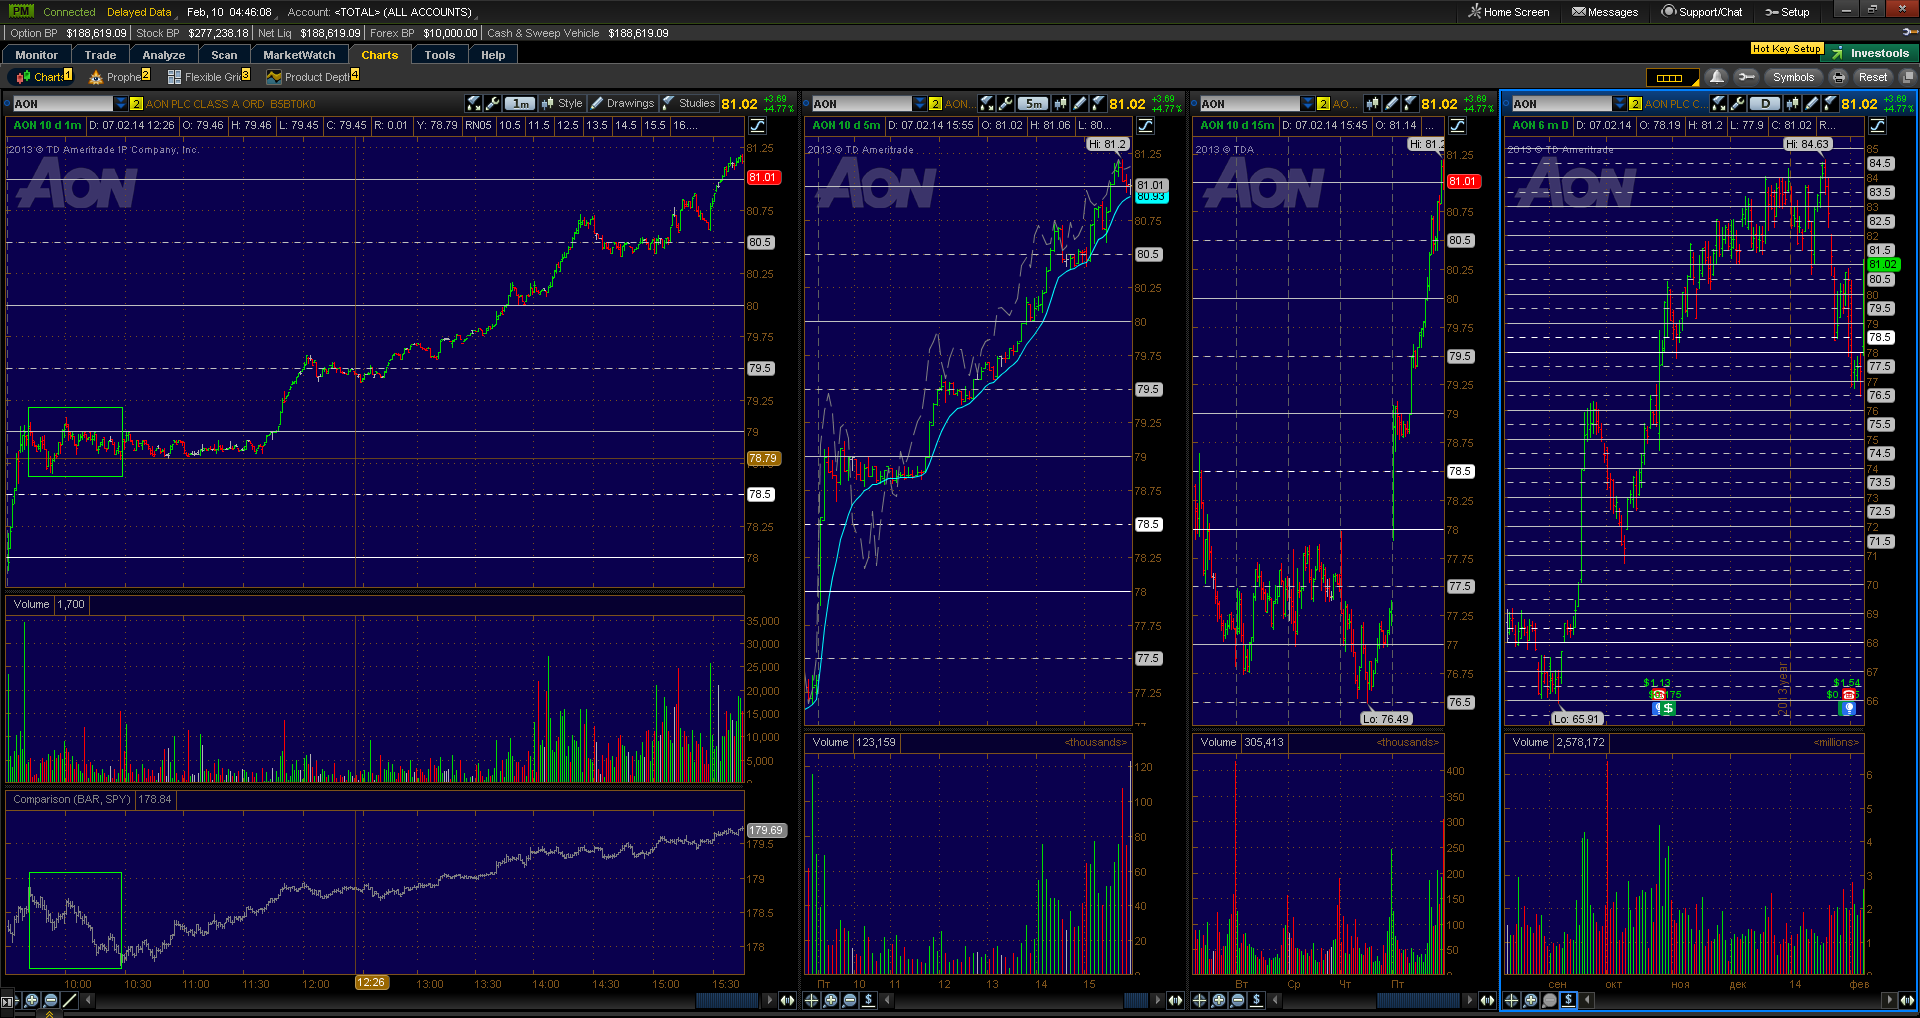
3) What time frame do you use for entries/exits, as I see your images show a 1min, 5min and 15min charts.
4) Could you please clarify your entries and exits (in terms of what you want to see the stock doing compared to SPY that makes you to decide to enter or exit)? Not very clear from your examples.
Thanks
Hi, rabcnesbit
1. Yes.
2. 1-min only.
3. 1-min.
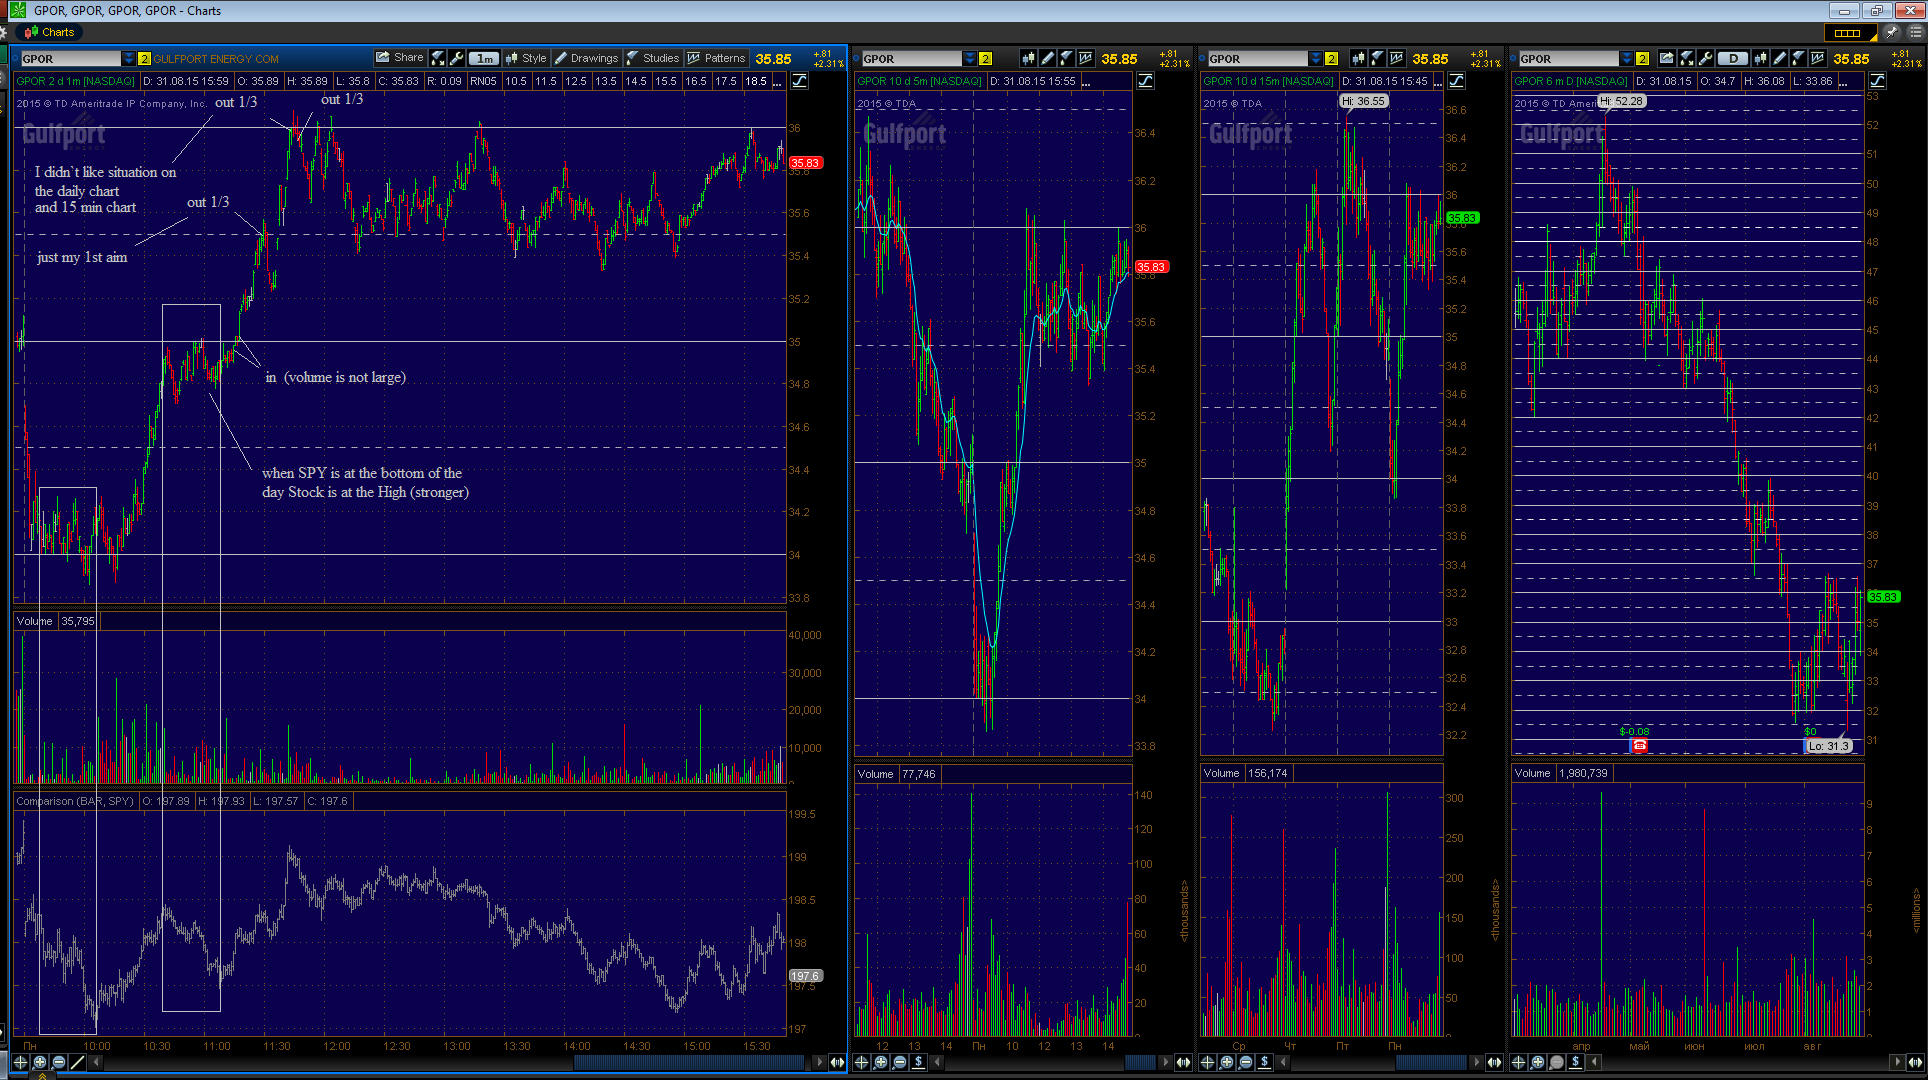
4. Entries – I just want to see situation when stock stops to follow SPY or goes in opposite direction (but not so far to "eat" all potential). Then I look for consolidation. Usually better entry point when SPY is near it`s support/resistance points (Close of previous day, day high/low, other levels) because there is chance that SPY will change it`s direction.
Exits – there is no difference for me what SPY makes if my stock goes in the right direction (I am just trailing). But if stock doesn`t react on positive SPY`s move for a long time and stays at the same place it is bad signal (for example stock doesn`t go up when SPY stopped it`s move down and goes up).
-
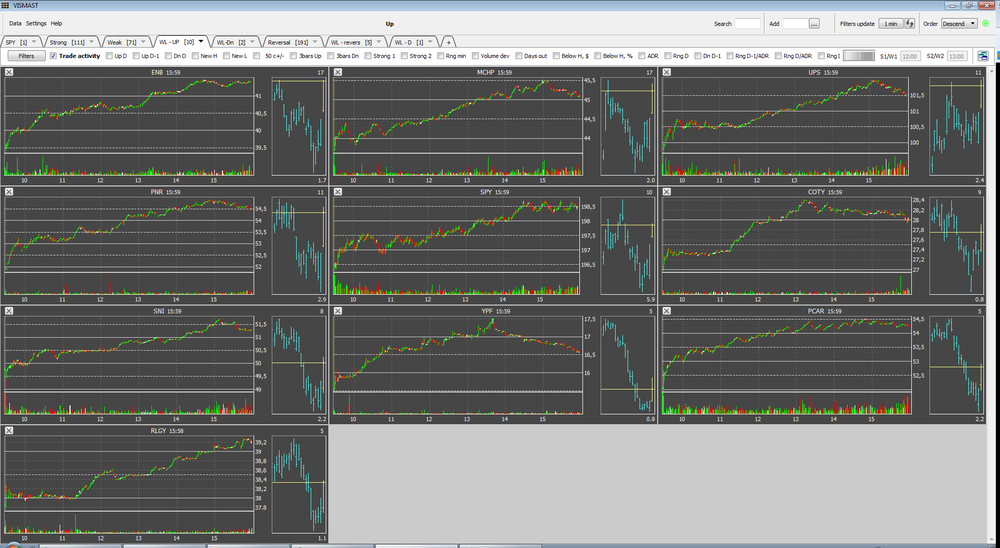
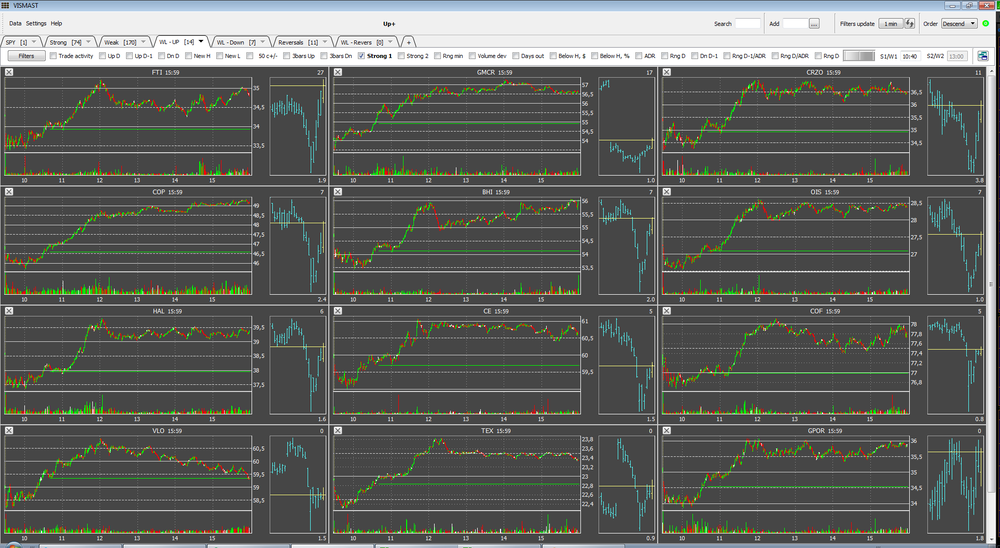
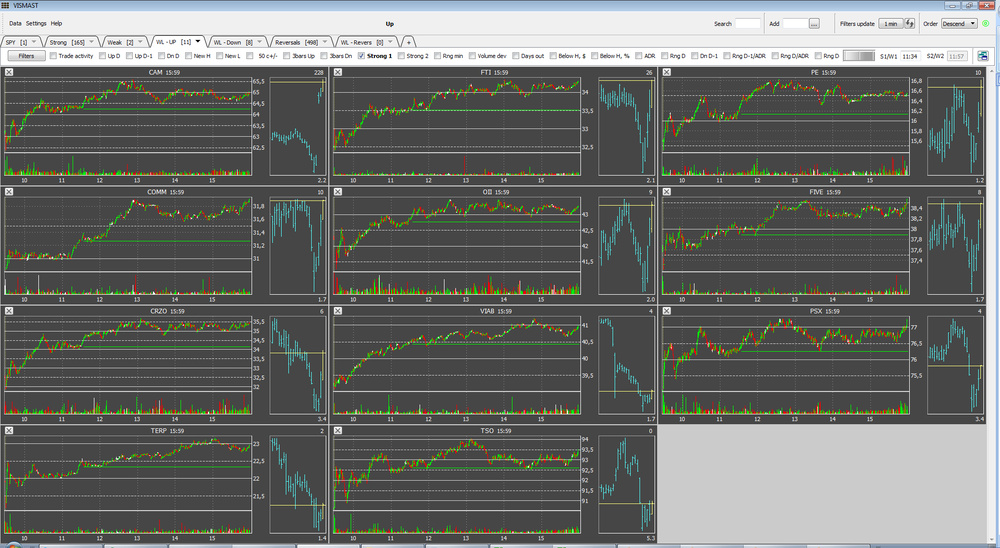
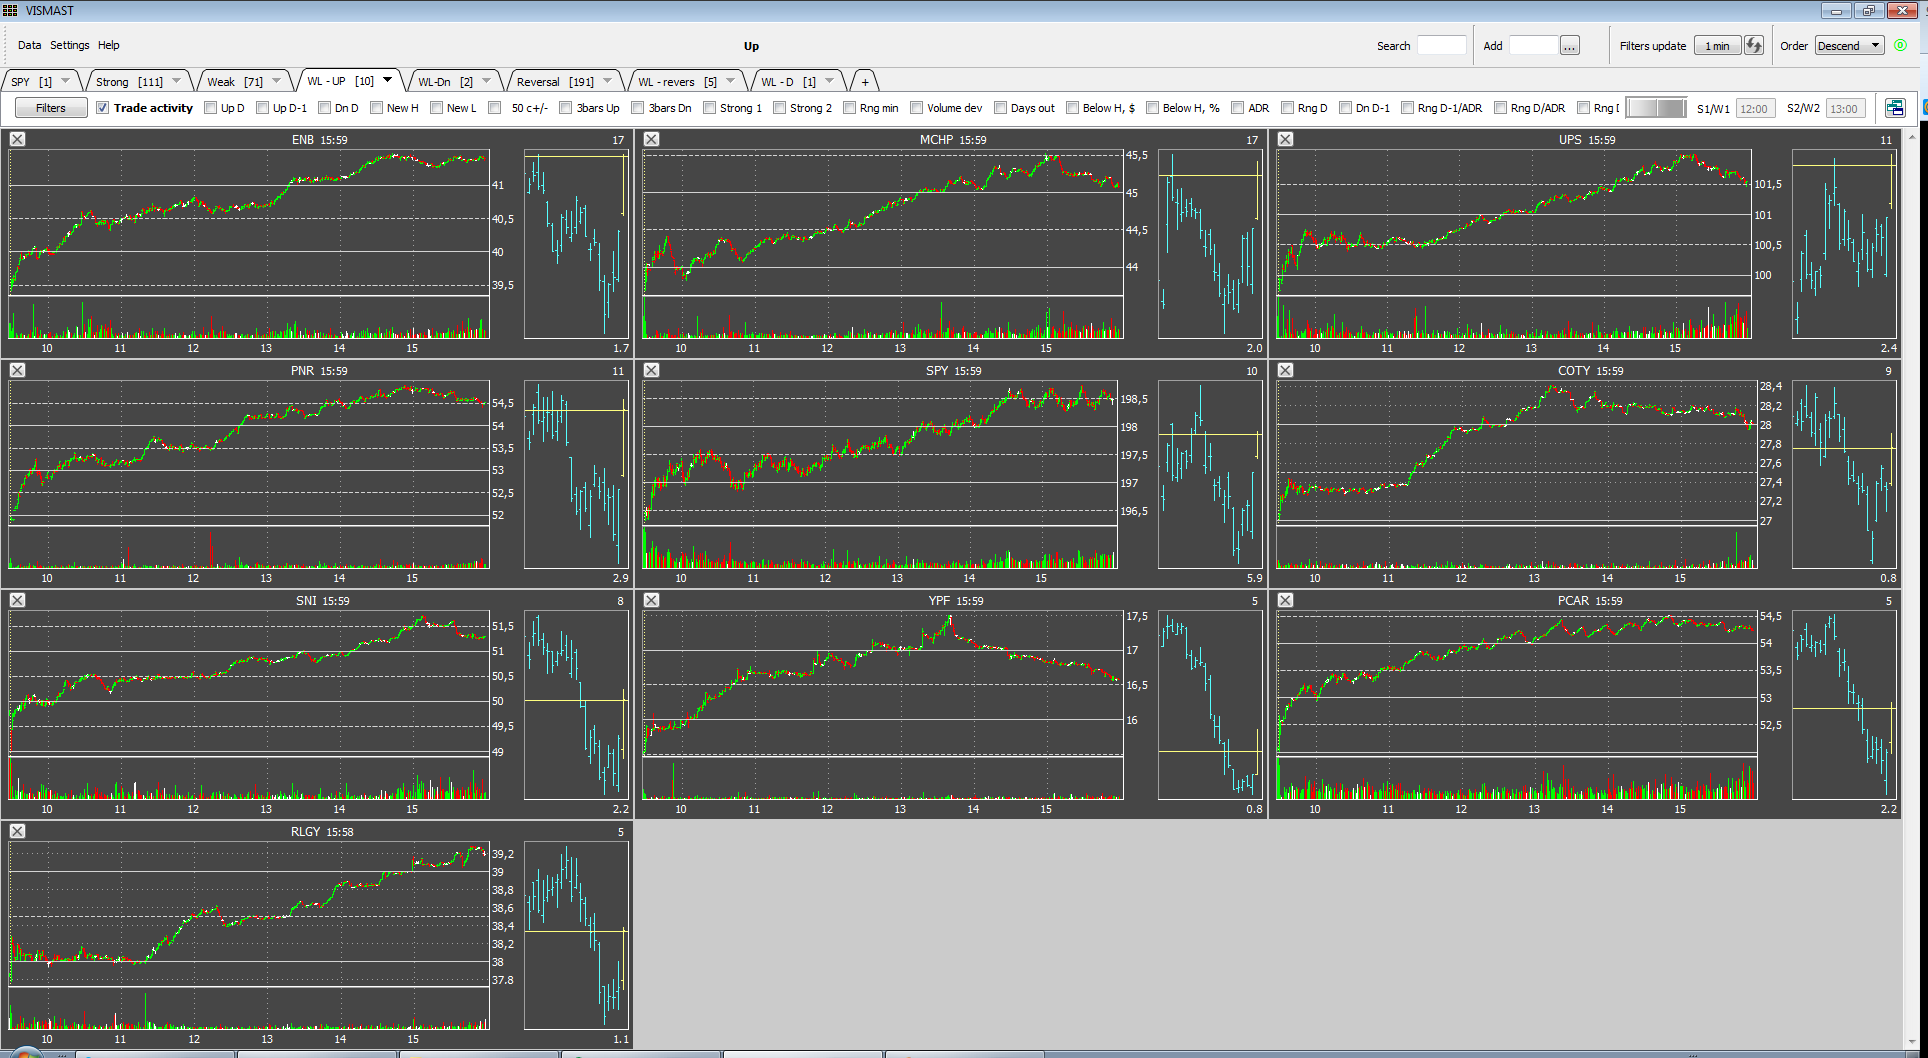
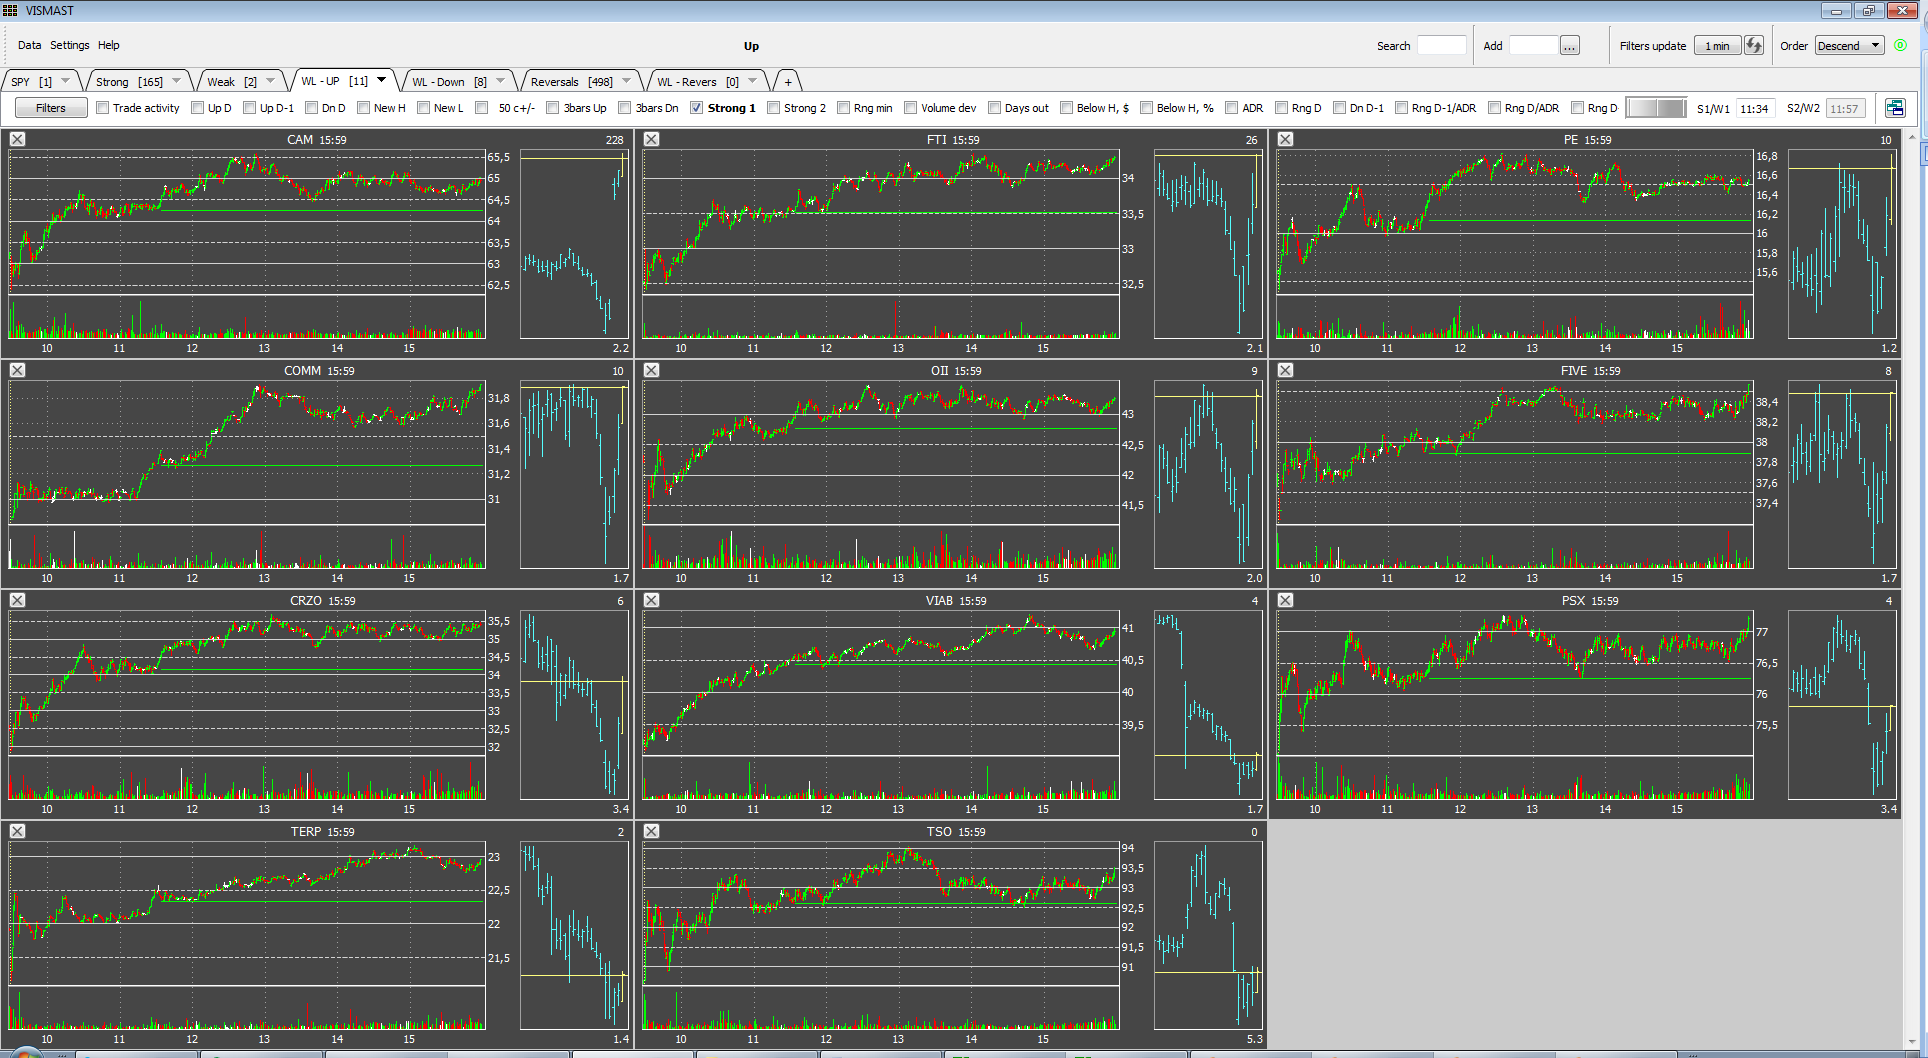
Today SPY was strong all day again: short pullbacks and higher lows.
In such days I recommend to trade only beautiful tight consolidations and today there were very many of them. In attached picture I have filtered the best ones from my WL (there were more different charts in fact). I traded COTY, RLGY (first consolidations), PNR (at $53.5), UPS (at $101) and ENB (at $41, a few lots only because of close strong resistance on daily chart).
You have to be patient and wait for your signals only. Some days are very rich for good setups, some days, conversely, very poor.
-
On friday SPY was very strong all day. Usually when SPY makes only short pullbacks it is hard to find clear strong/weak stocks. So I try to find stocks with good daily charts and beautiful consolidations on intraday charts.
On friday I found strongest stock on daily chart with good breakout level and good triangle consolidation.
-
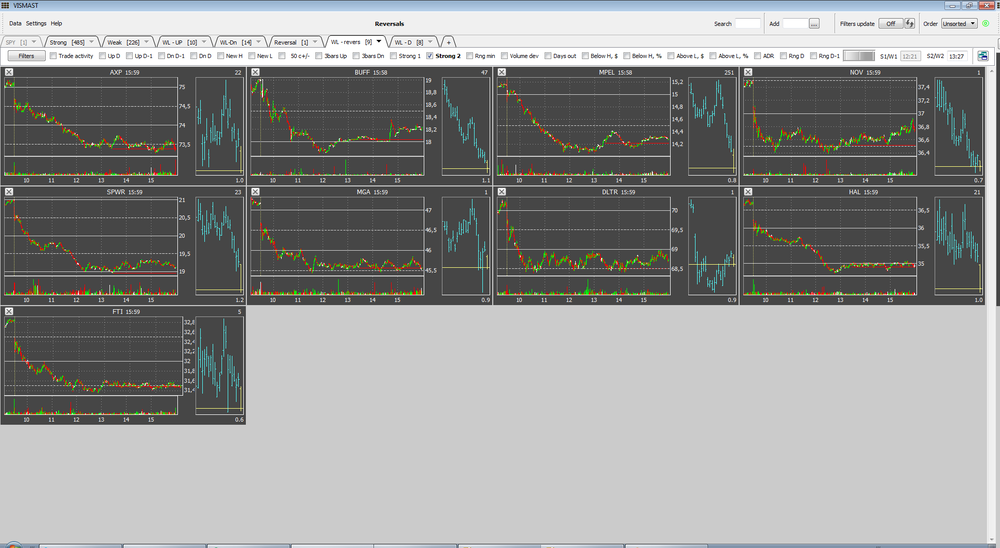
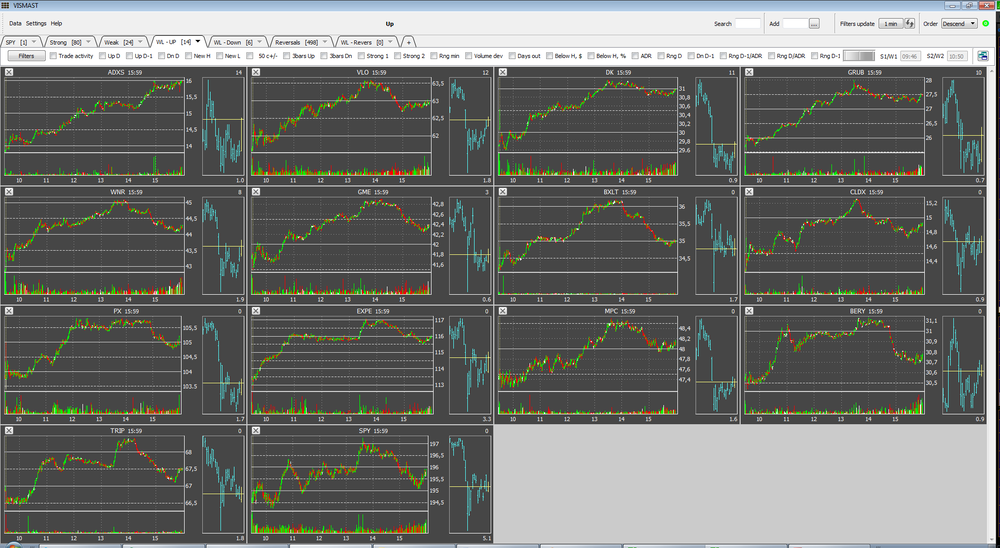
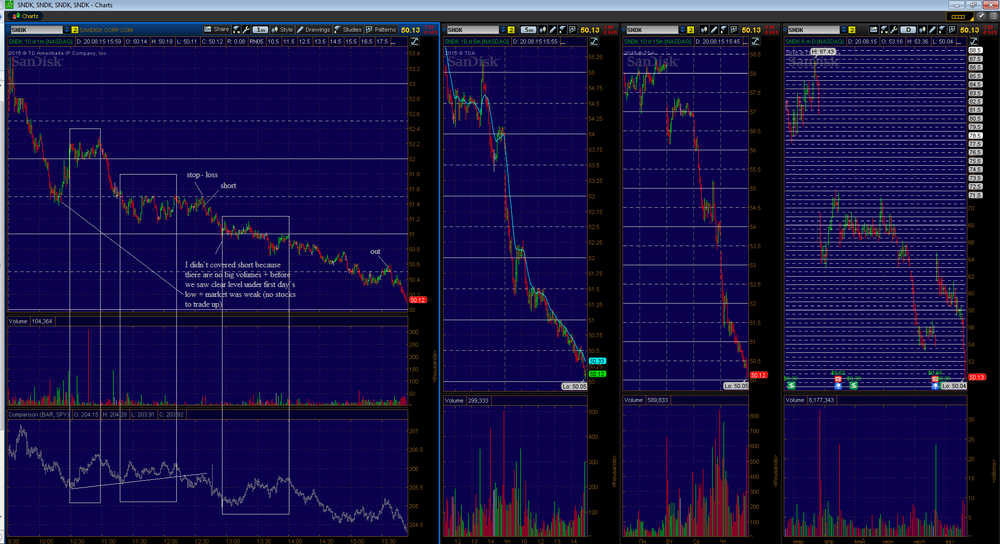
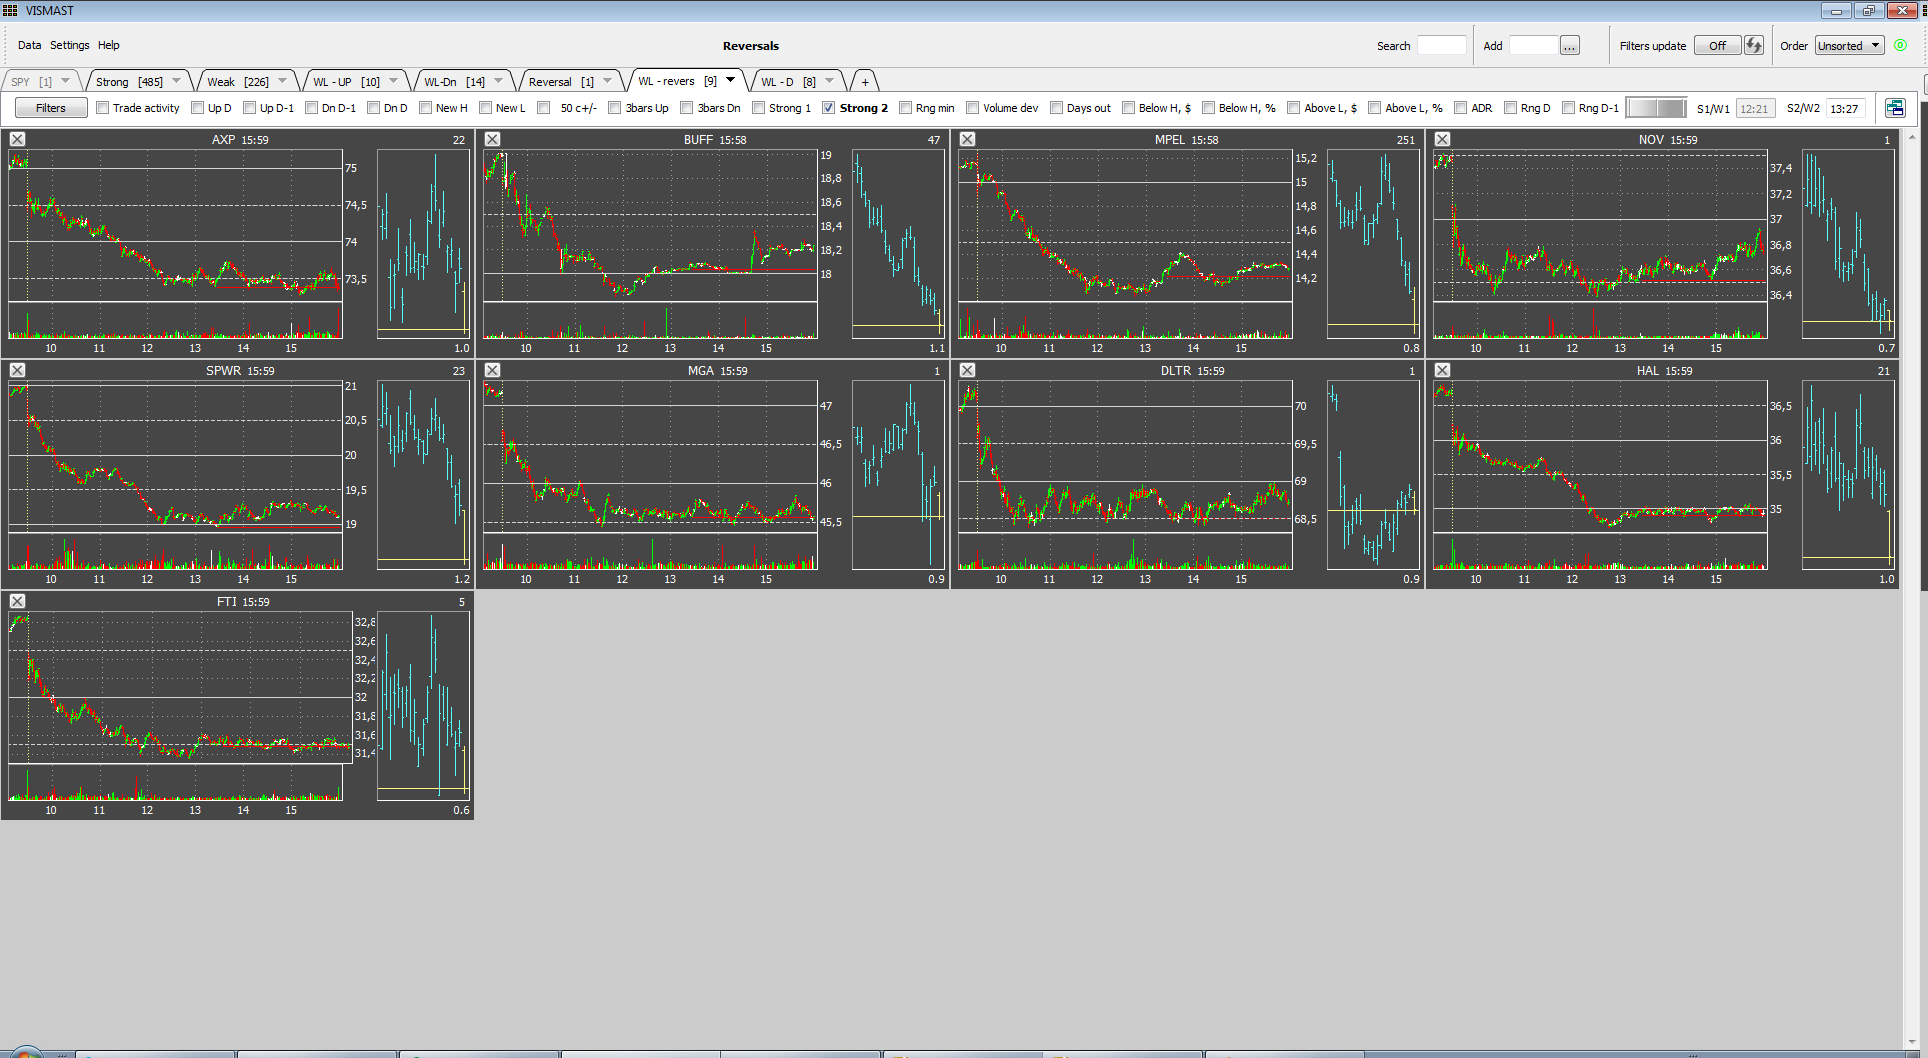
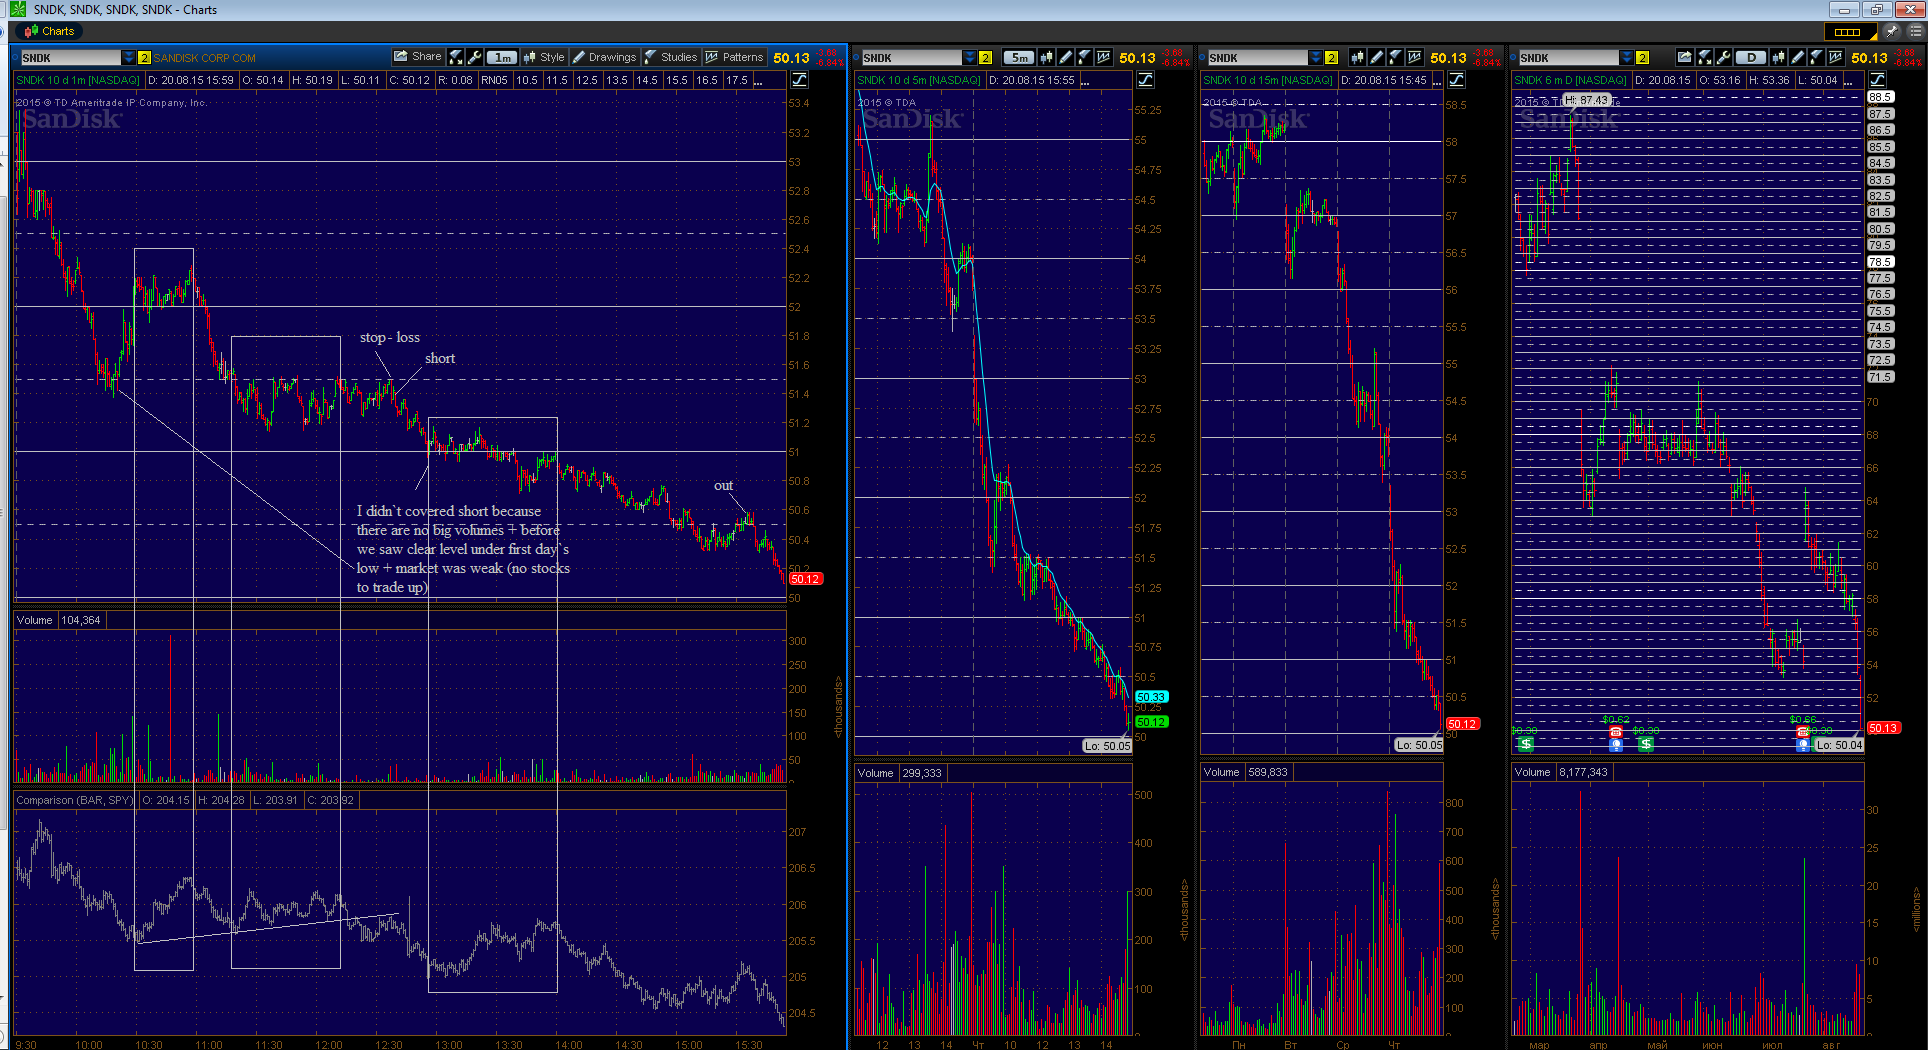
Today was very weak day (down during all day) when even the strongest stocks didn`t have a chance. In such day better not to trade reversals (even with the best setups).
See attached printscreen how strong stocks didn`t go up and stayed near their lows. In other circumstances these stocks could fly up like rockets.
Some years ago I tried to catch reversals of strong stocks till session close and finally I was exhausted by quantity of stop-losses catched.
If you see that strong stocks don`t go up/ don`t react properly (or you made some trades but they failed) you have to stop trading. In such situation monitoring of stocks behaviour helps me (other stocks without my setups can start moving earlier so I can see their reaction).
-
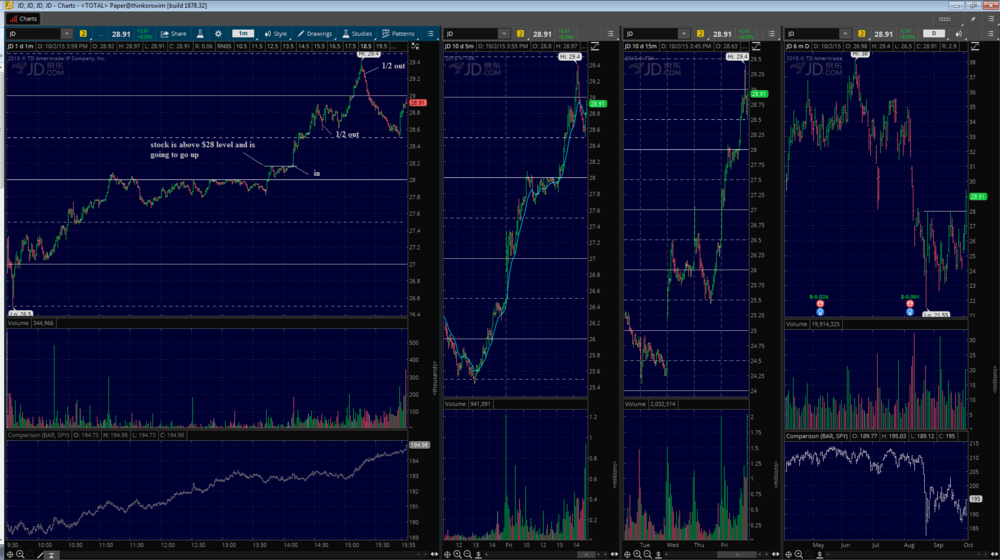
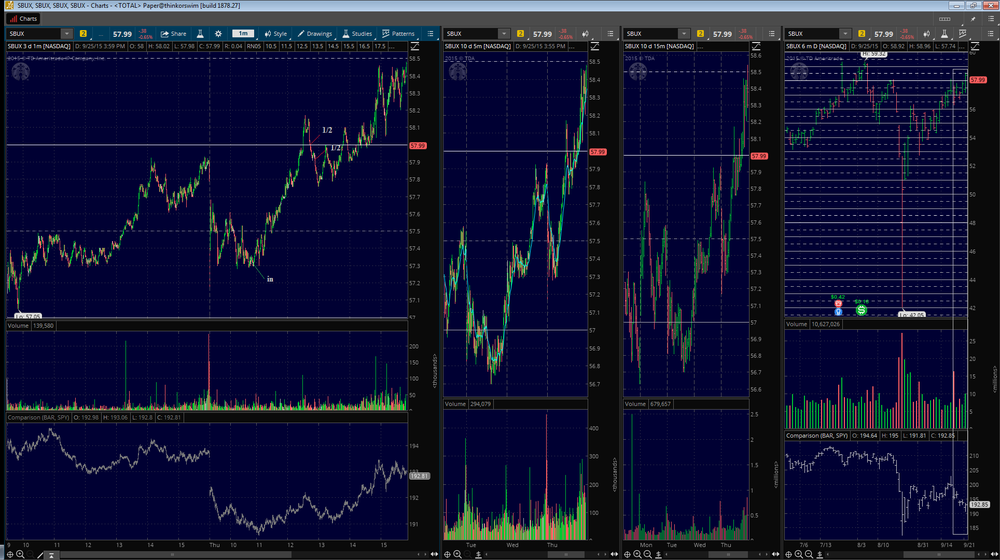
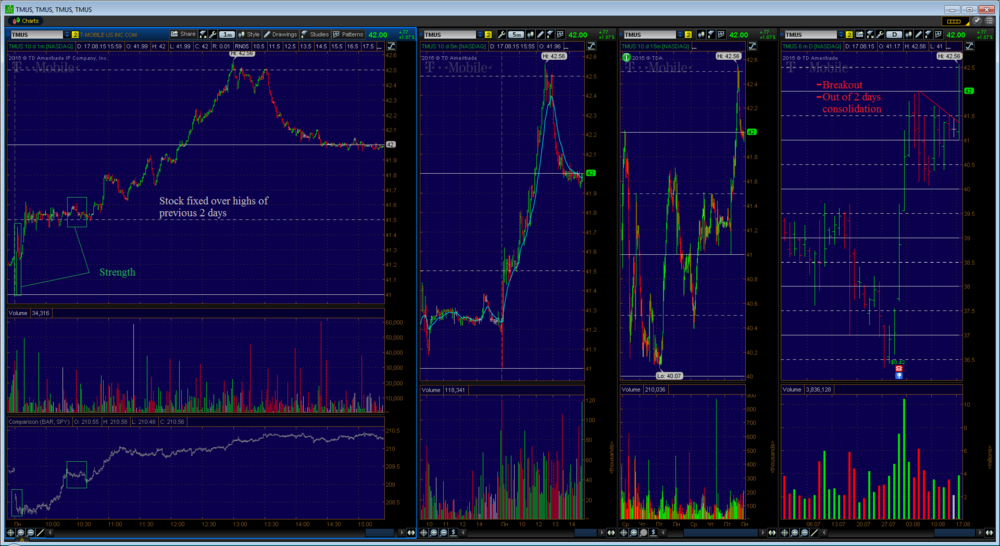
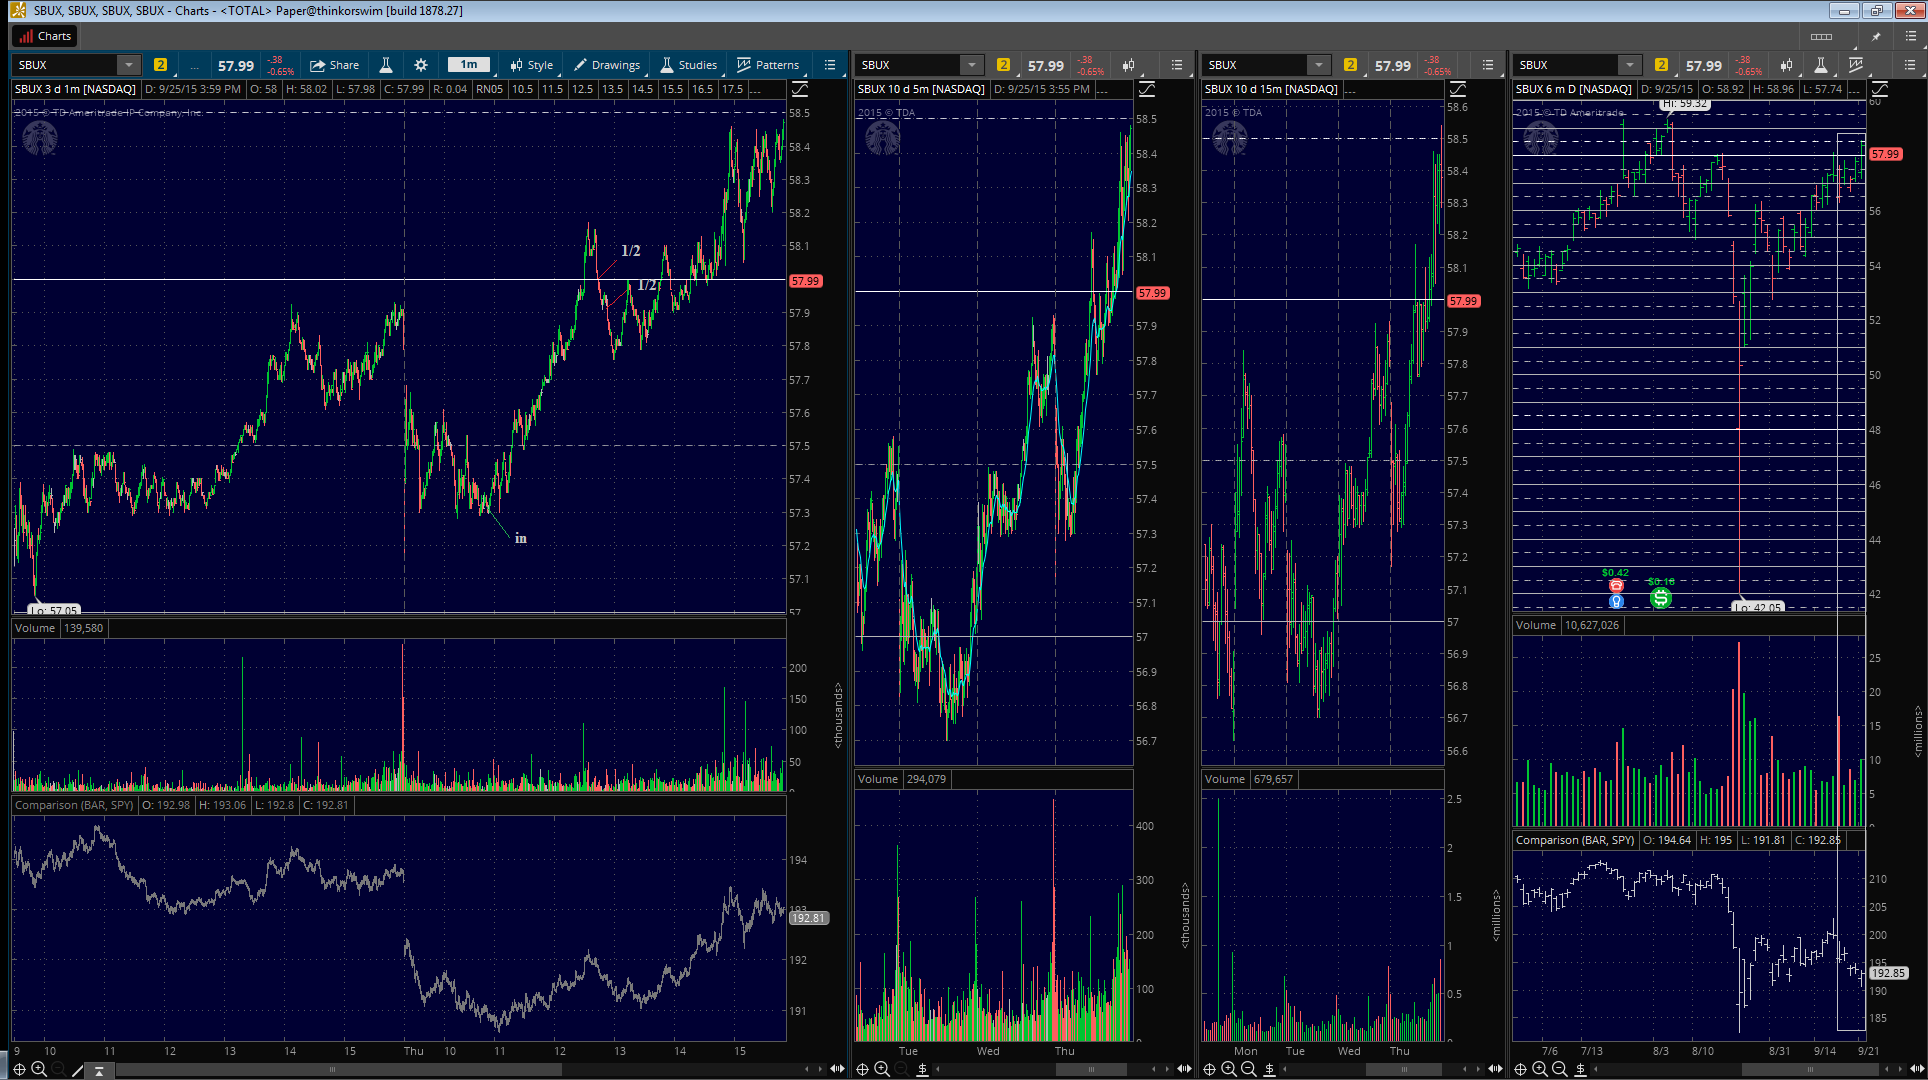
Strong/weak stock from watchlist can demonstrate continuation of strenght/weakness next day.
I catched SBUX on Wednesday but didn`t trade it. On Thursday it was in my watchlist again so I tried to trade it. This stock was stronger than SPY on the daily chart + stayed on the wednesday`s level strictly.
-
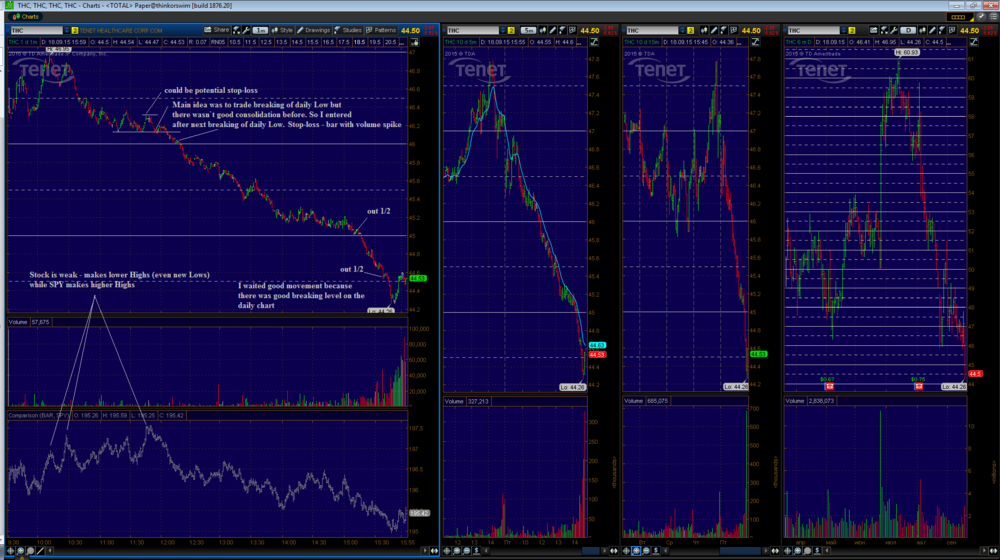
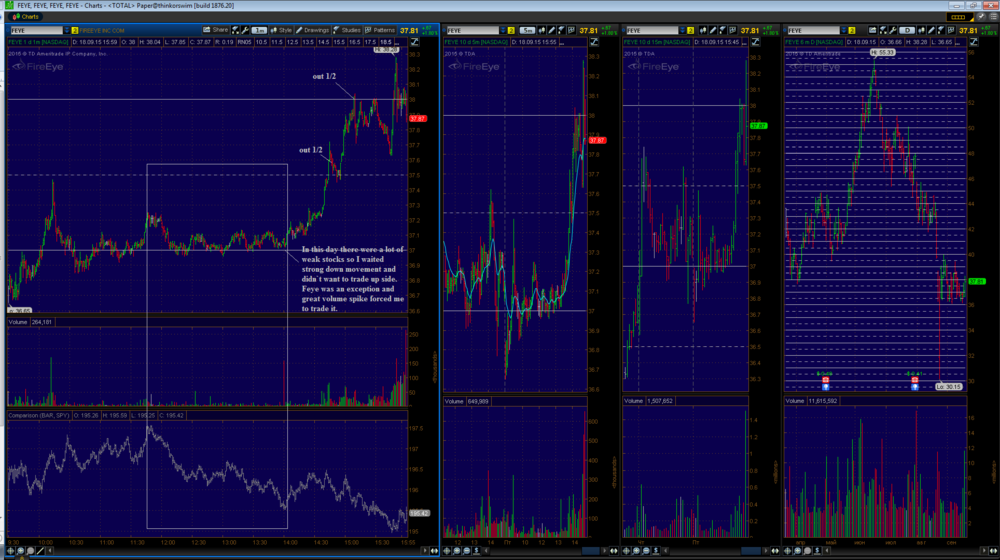
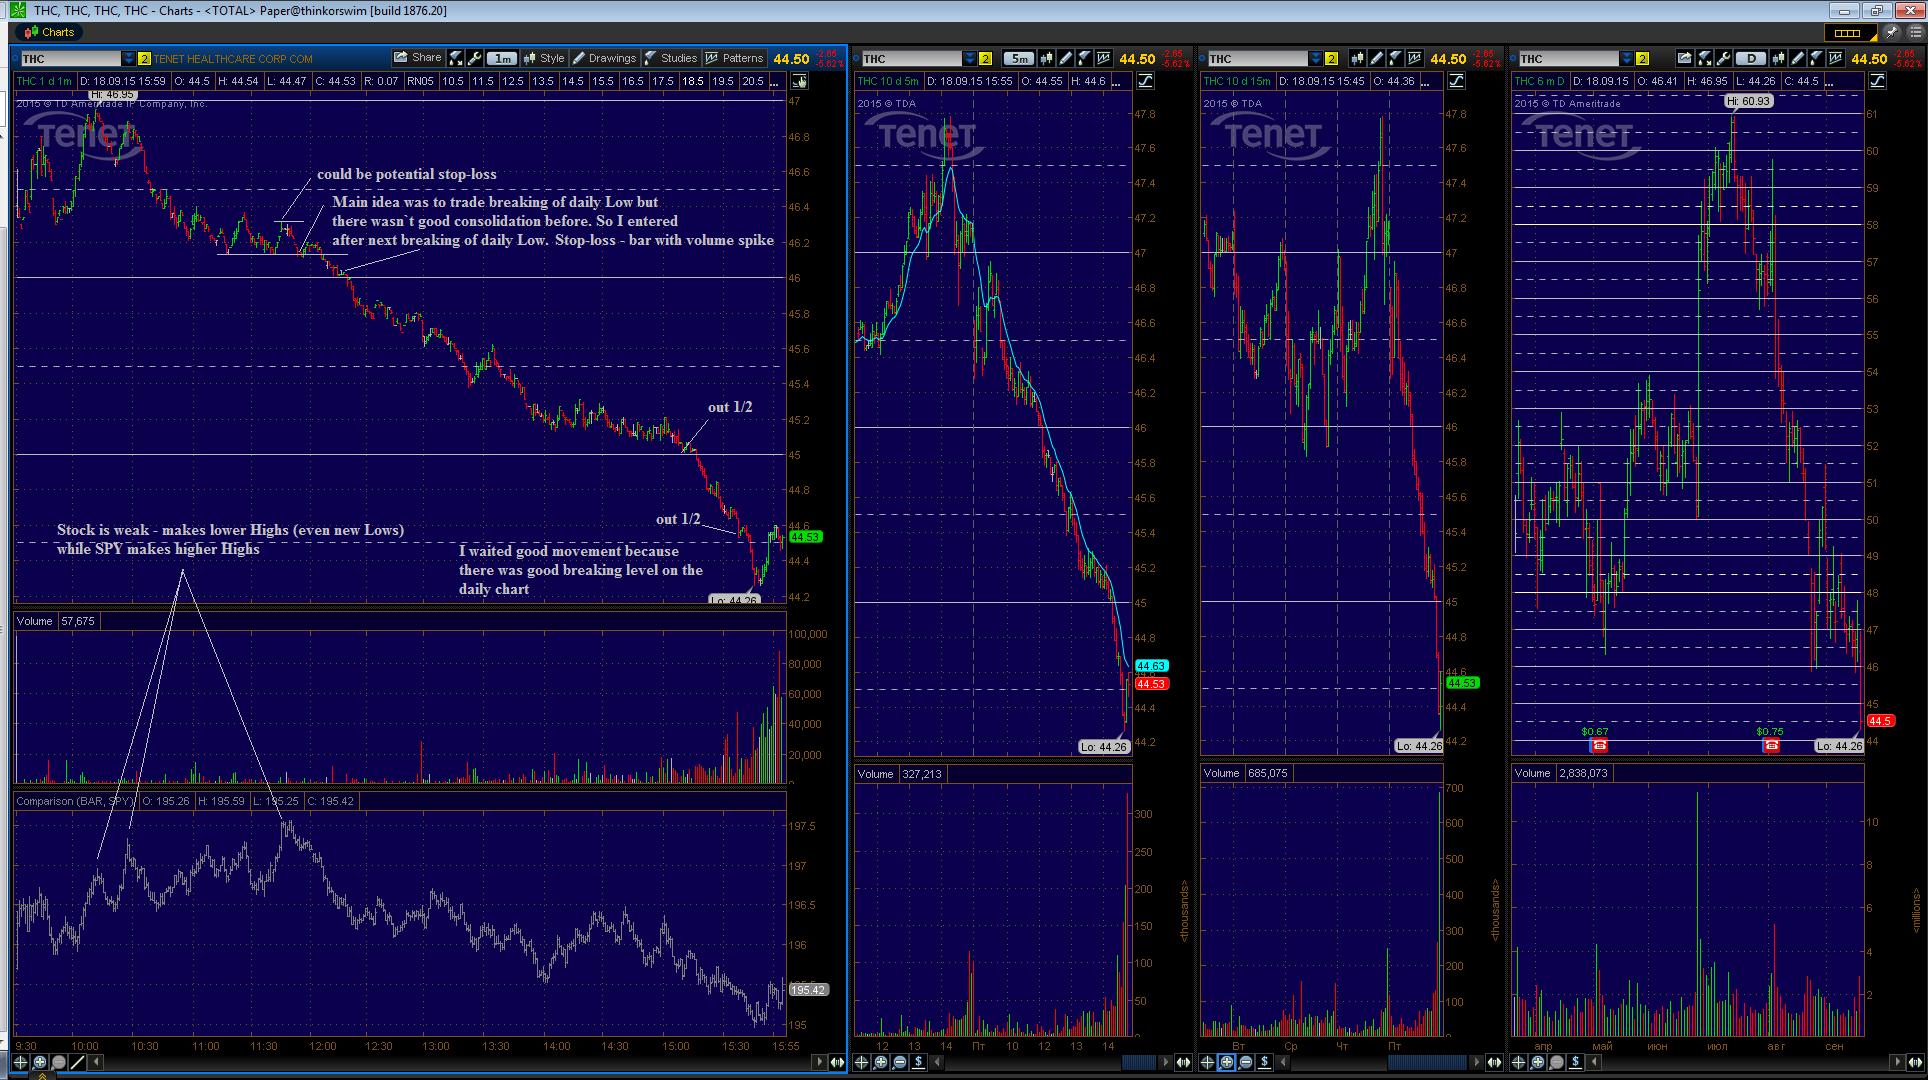
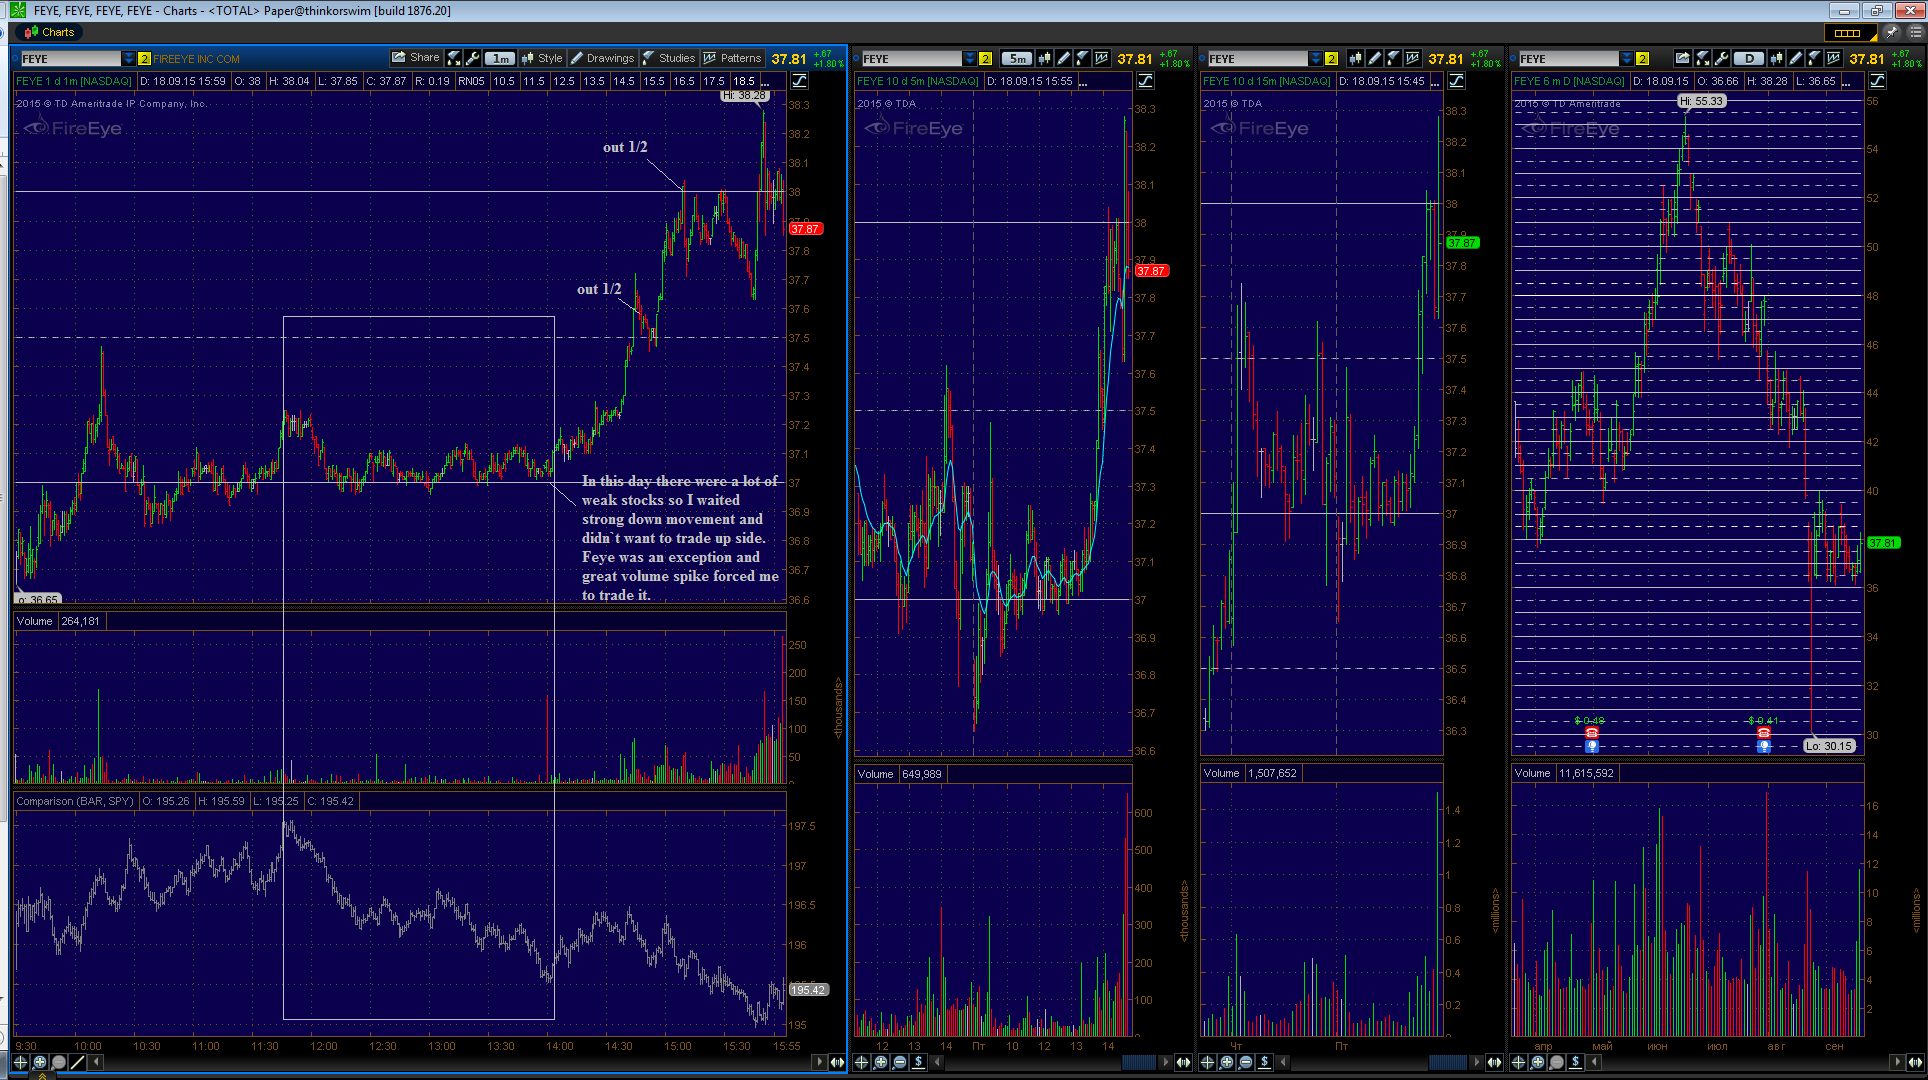
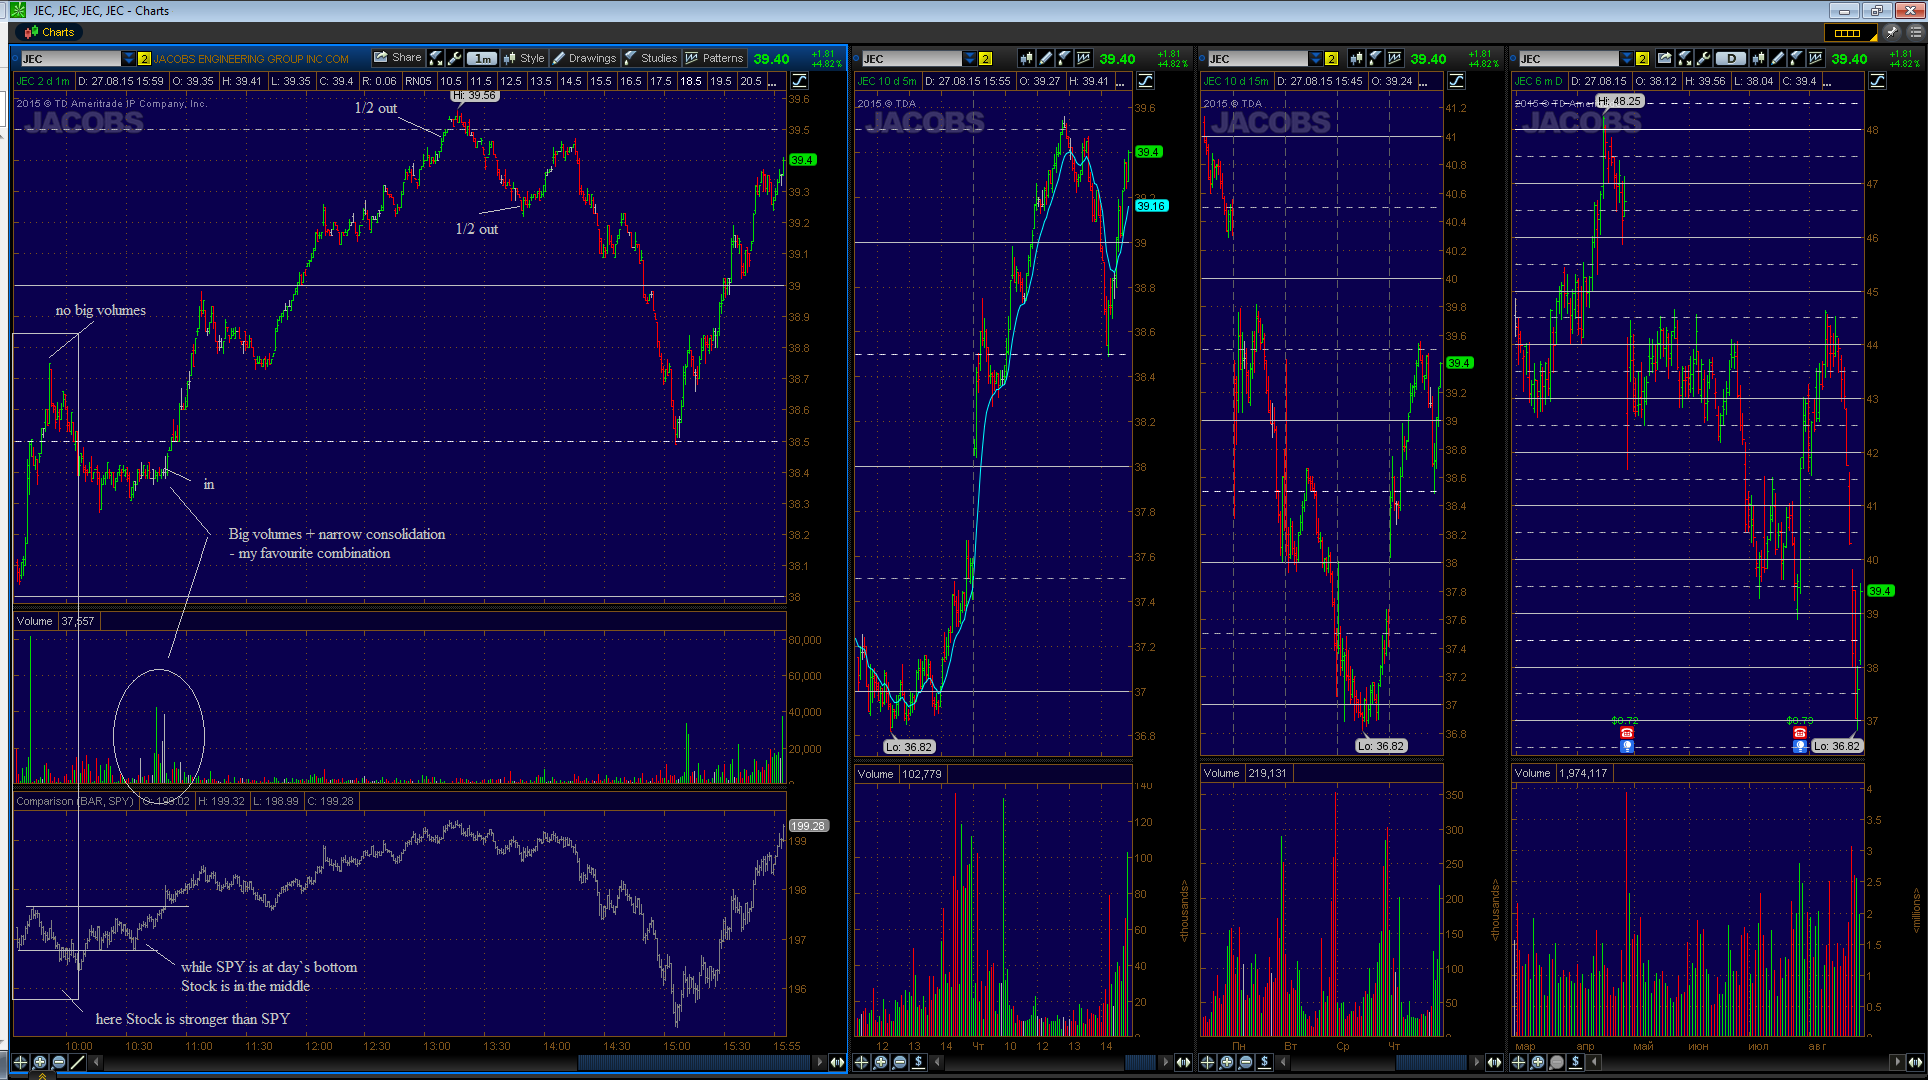
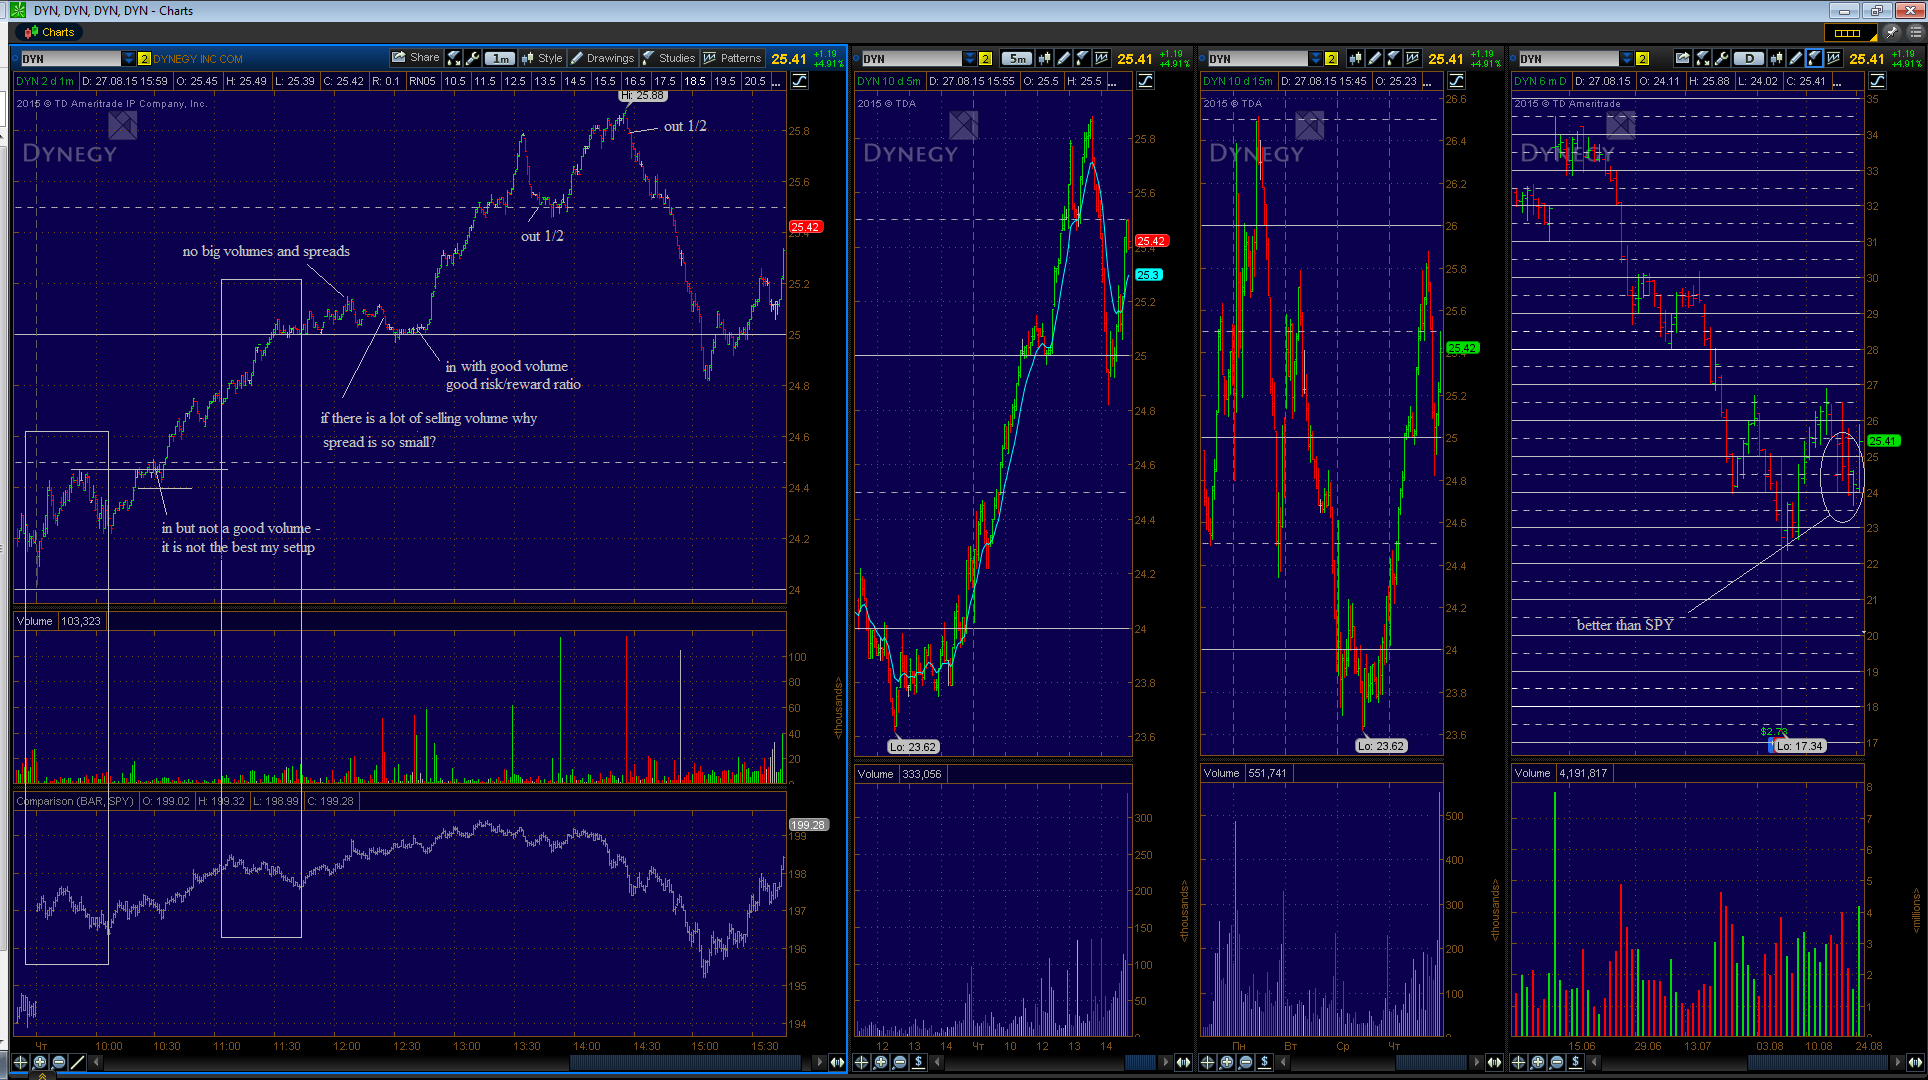
Some of my friday trades.
It is not enough to have strong/weak stock behavior for me. I need good entry point with good stop-loss level (consolidation with volume spike bar usually) - see example with THC. In other case I can make trade with small volume only (200-300 shares).
I try to make few trades with good volume than to waste energy for a lot of small shady trades.
-
You are showing some charts that is good but can you show some statistics of your account like we can see at http://www.myfxbook.comTrix, I am not interested in students and other commercial teaching services or in investors. So I don`t need to show my account. Also it is not a trader`s diary.
For me TL is great informational resource to search information about different trading styles, to find answers for questions. In my opinion it is better to read, analyse and try (making real trades) and again analyse (your own trades) than to look at useless beautiful statistics.
I show how strategy works and how I choose stocks to trade + some my thoughts. Many years ago I read a lot of useful information here (for example about VBA, volume) and now I am sharing with some information (there was a lot of work before - I made print screens and videos of my trades every day, analyzed them, tried different strategies). Maybe it will help to newbie traders (plus I consolidate and structure my thoughts for myself).
About beautiful charts - of course it is not so beautiful every day. There are trades with stops and there are days without trades (and it is not easy not to trade). And Yes, I am filtering a lot of stocks to find beautiful charts (and I am trading only best of them) because they give best risk/reward ratio.
-
There are good days and bad days. To be in profit you have to be consistent.
Today was a good day - SPY was volatile. Usually to have a good movement about $1 and more, 30-60 min consolidation is needed.
Here is my WL. Any ideas what stocks (two of them) I traded today?
-
Tuesday (09-01-2015) - didn`t find any good stock. Market was choppy. Sometimes there are such days.
Wednesday - made some trades.
Thursday - was hard to trade trends. After 11:00 market changed direction and was weak. Even if there were strong stocks for some period of time down bars broke support levels (even the best ones).
Thus if you see that strong stocks don`t go up after good support levels and a lot of strong levels are broken (when stocks are strong they make higher lows and don`t break their support levels) be very careful or don`t trade this side in this day.
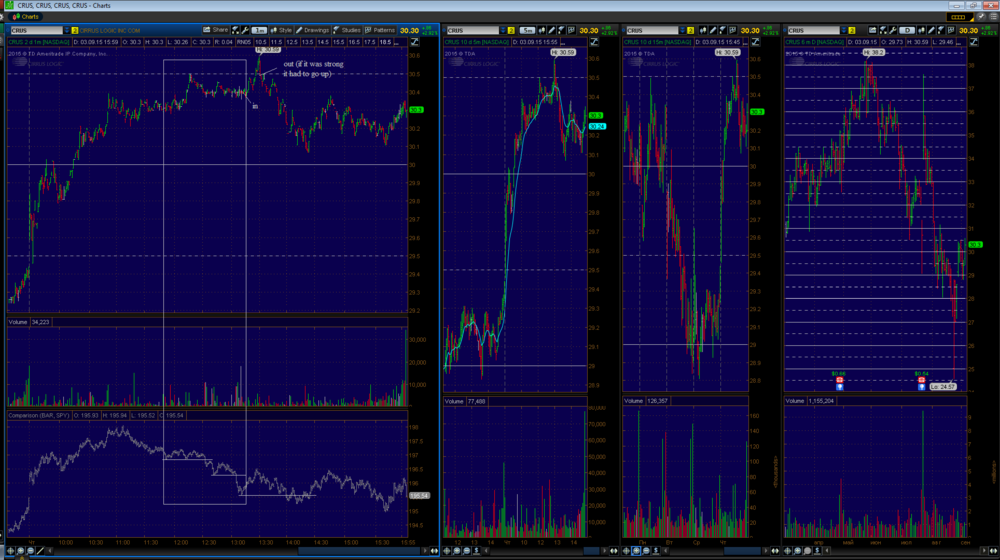
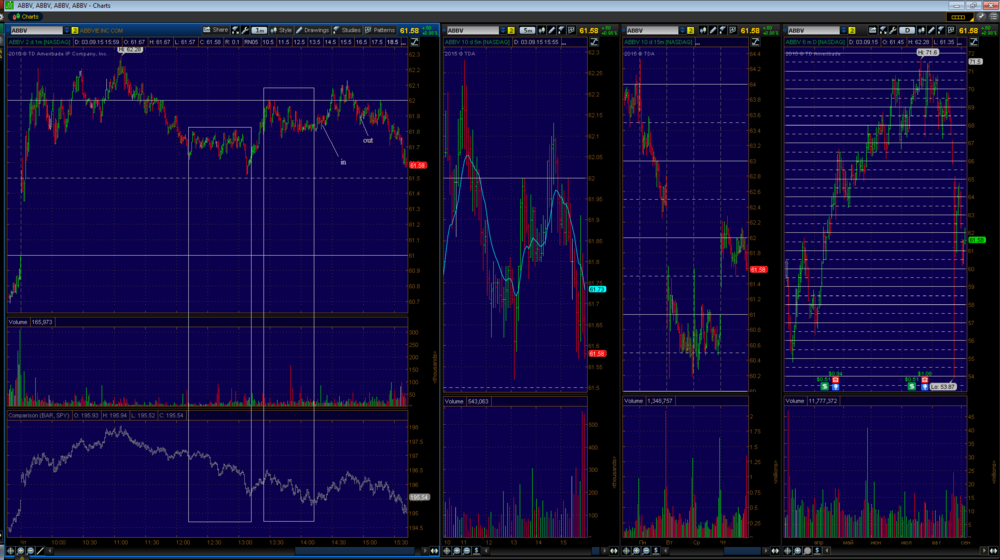
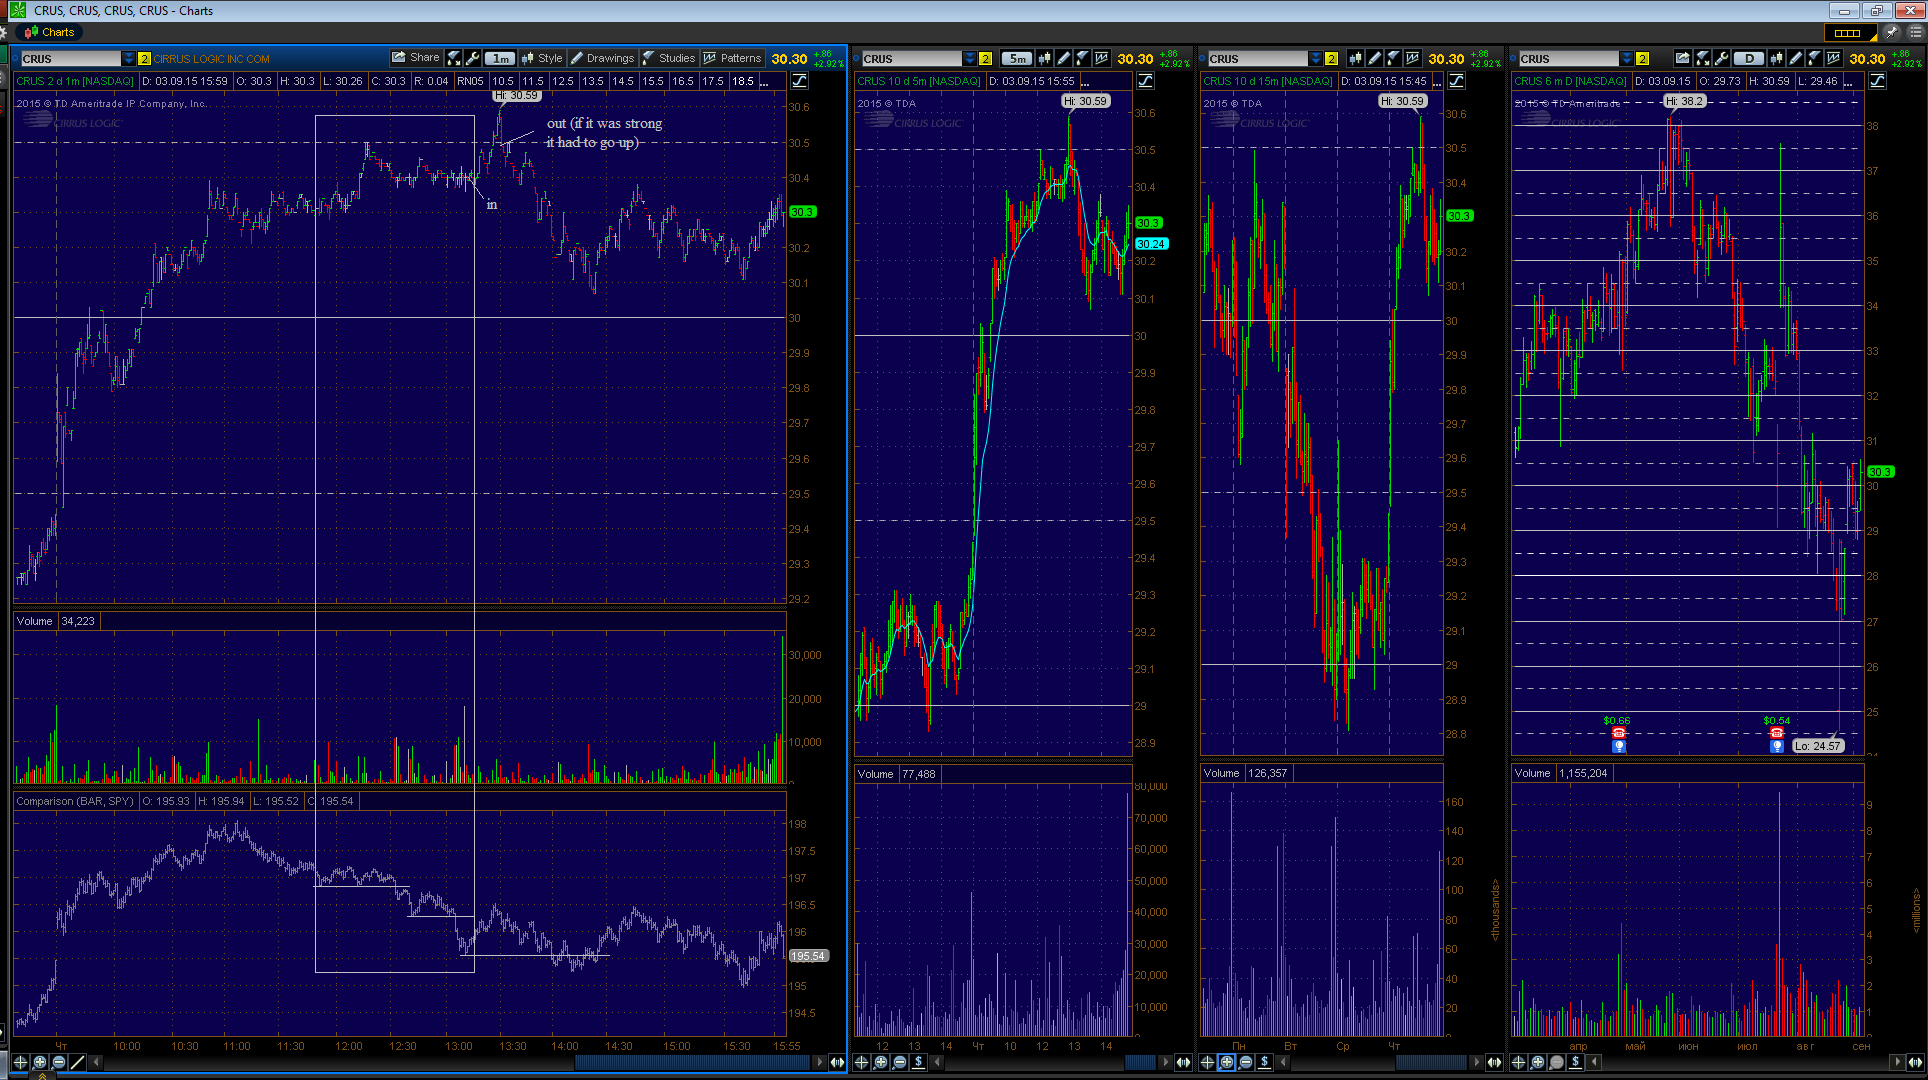
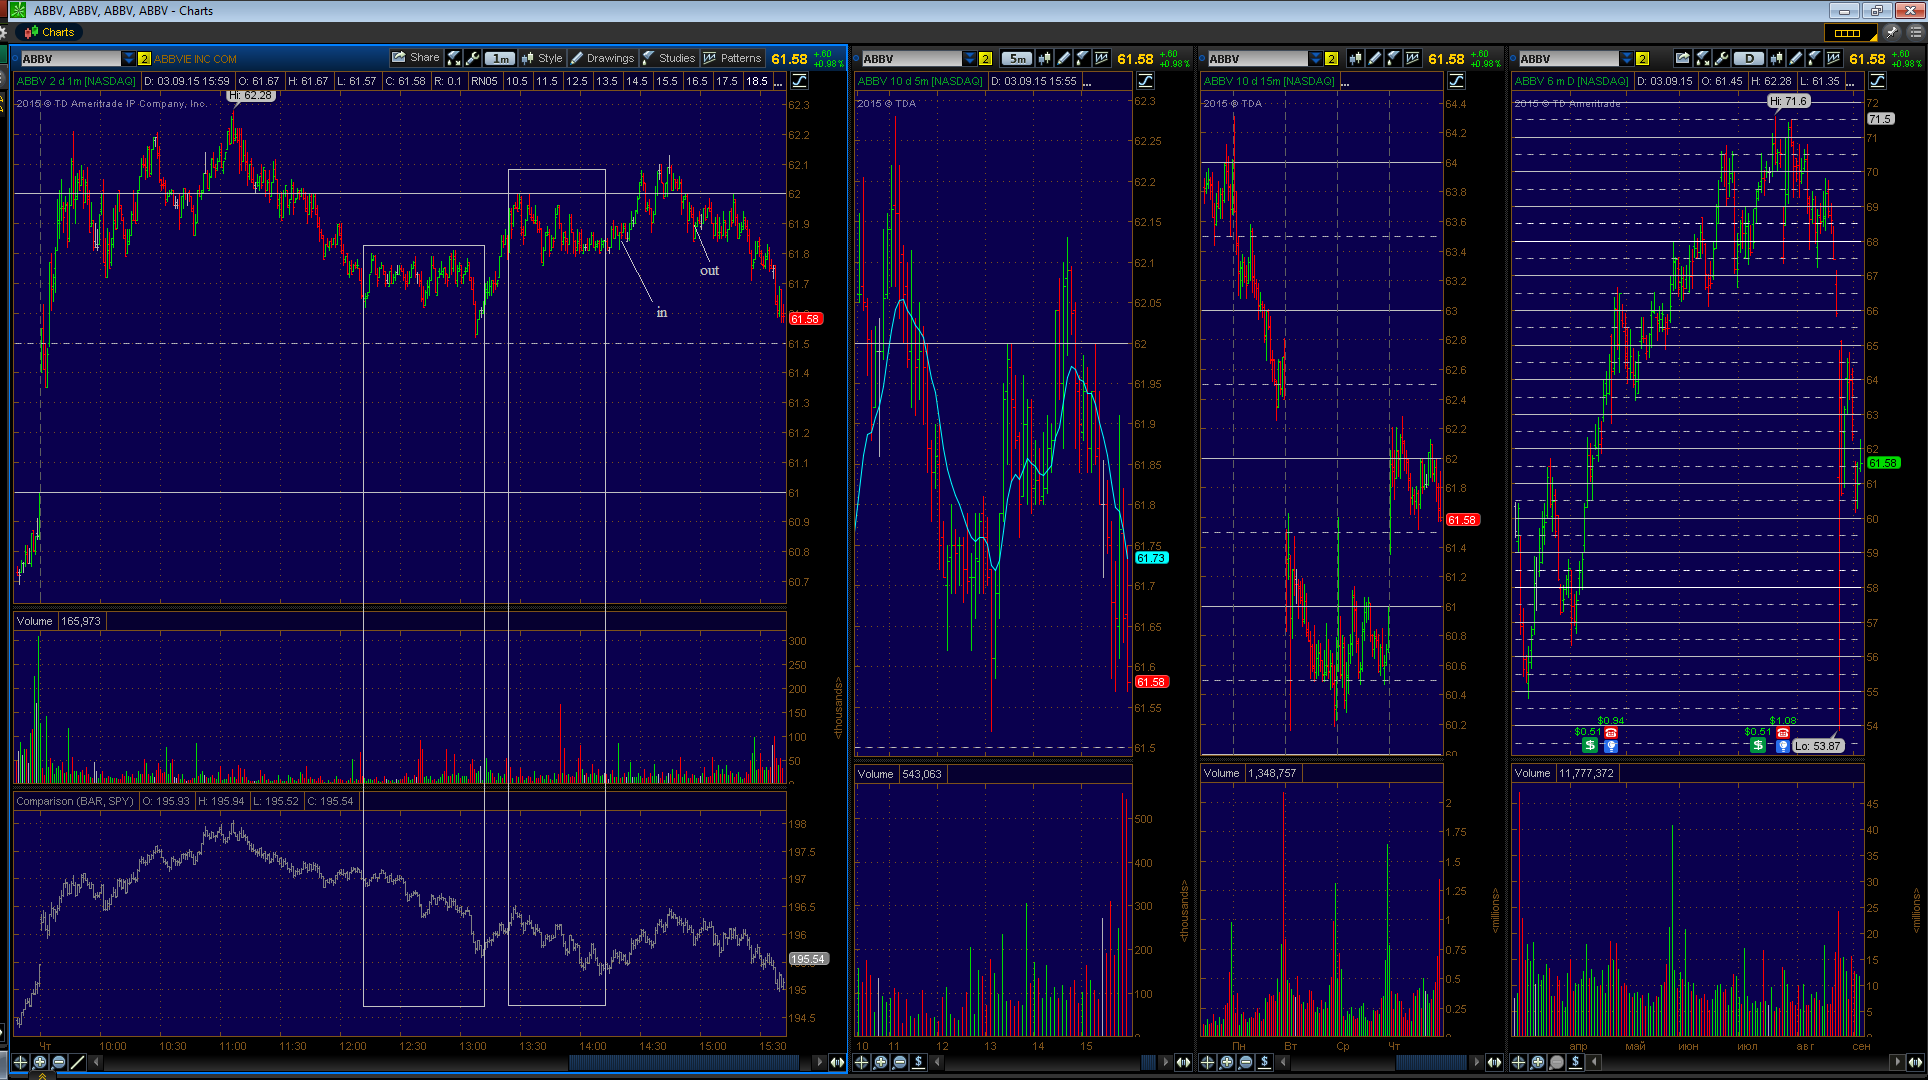
I tried to trade CRUS and ABBV - unsuccessful. As I knew that market was very weak I didn`t wait my stops and covered my positions before.
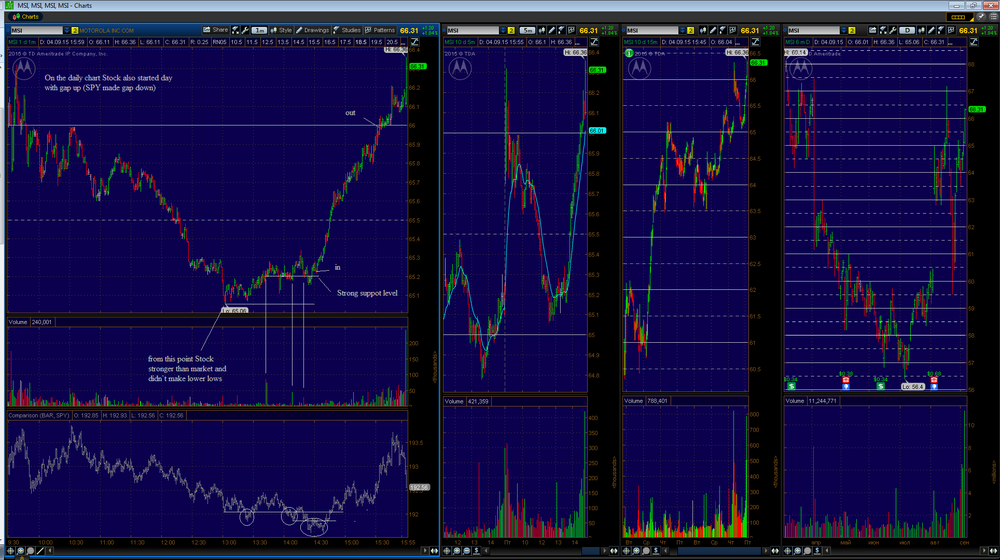
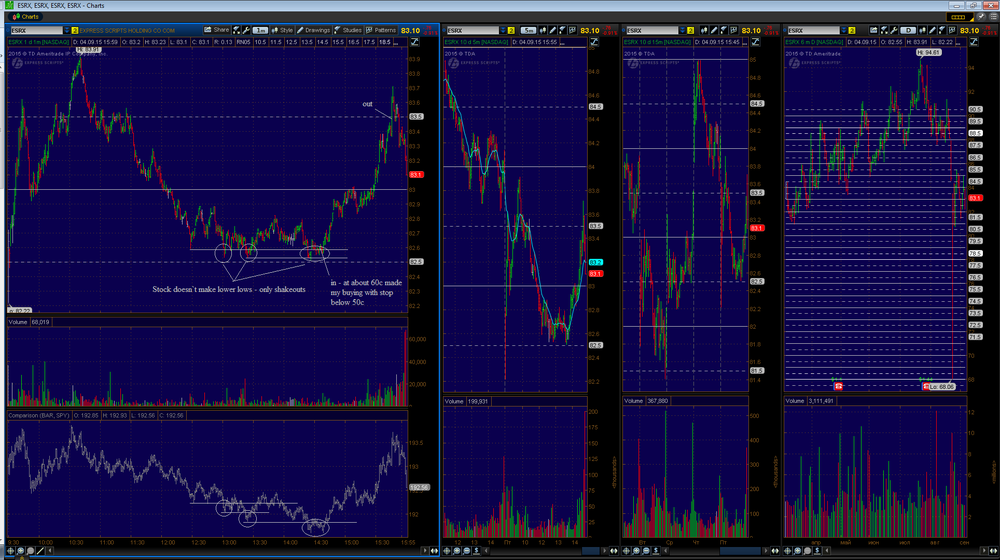
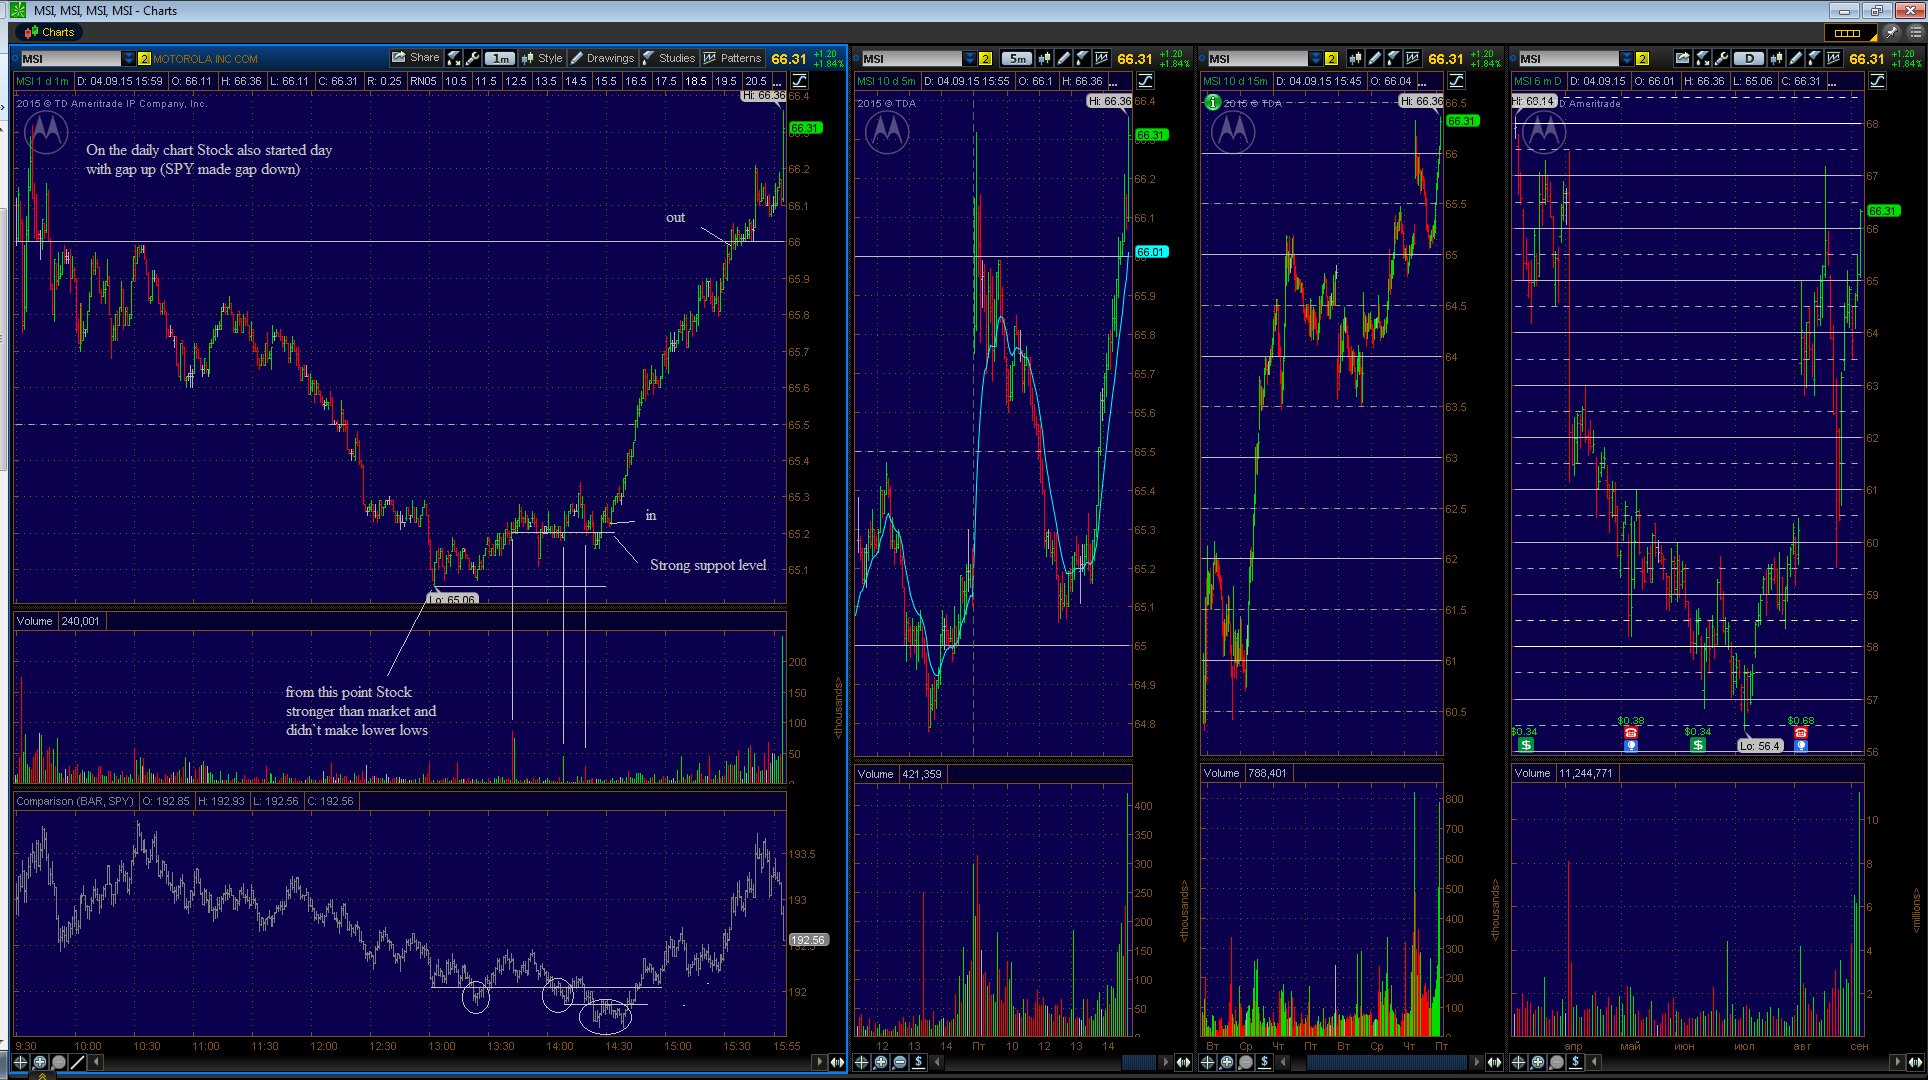
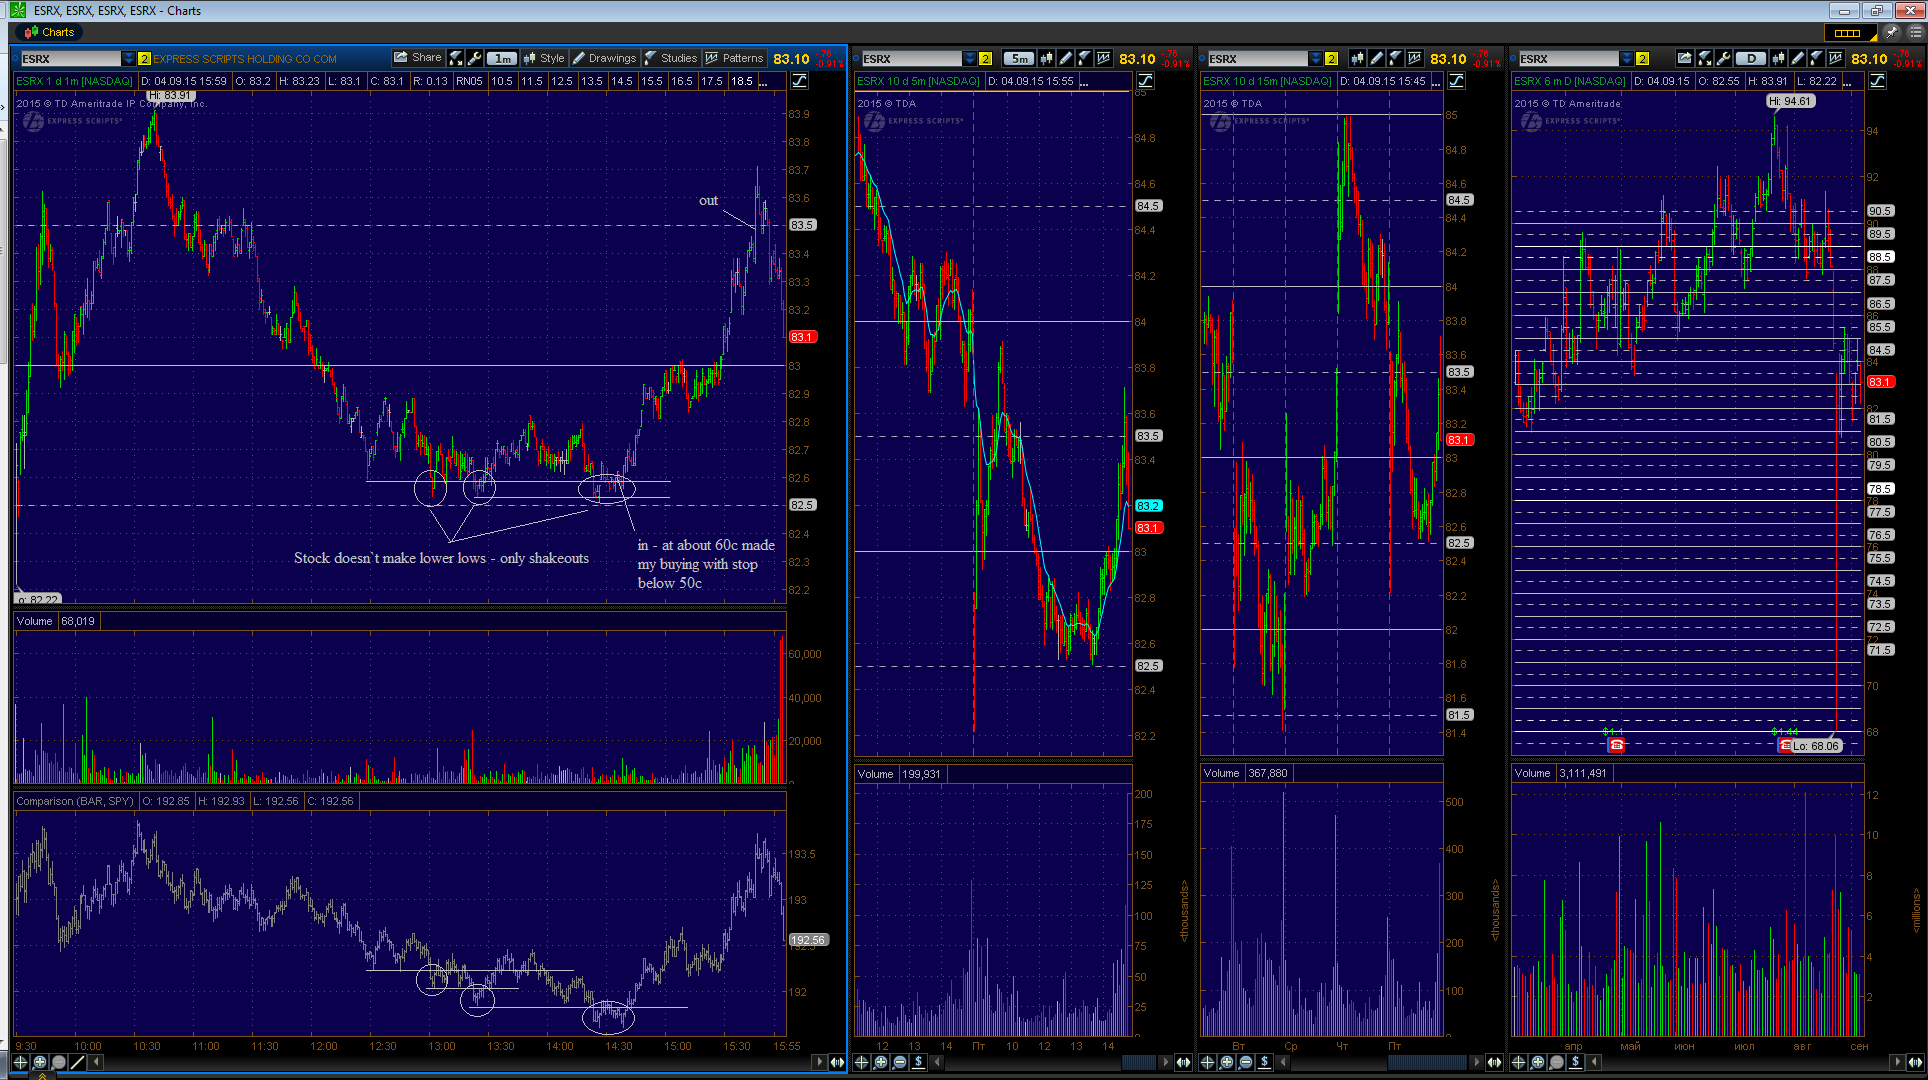
Friday - market was weak but it is rarely if previous day was weak till end of the day next day also is weak all day. So I tried to trade - some of them attached below as usually (MSI, ESRX).
-
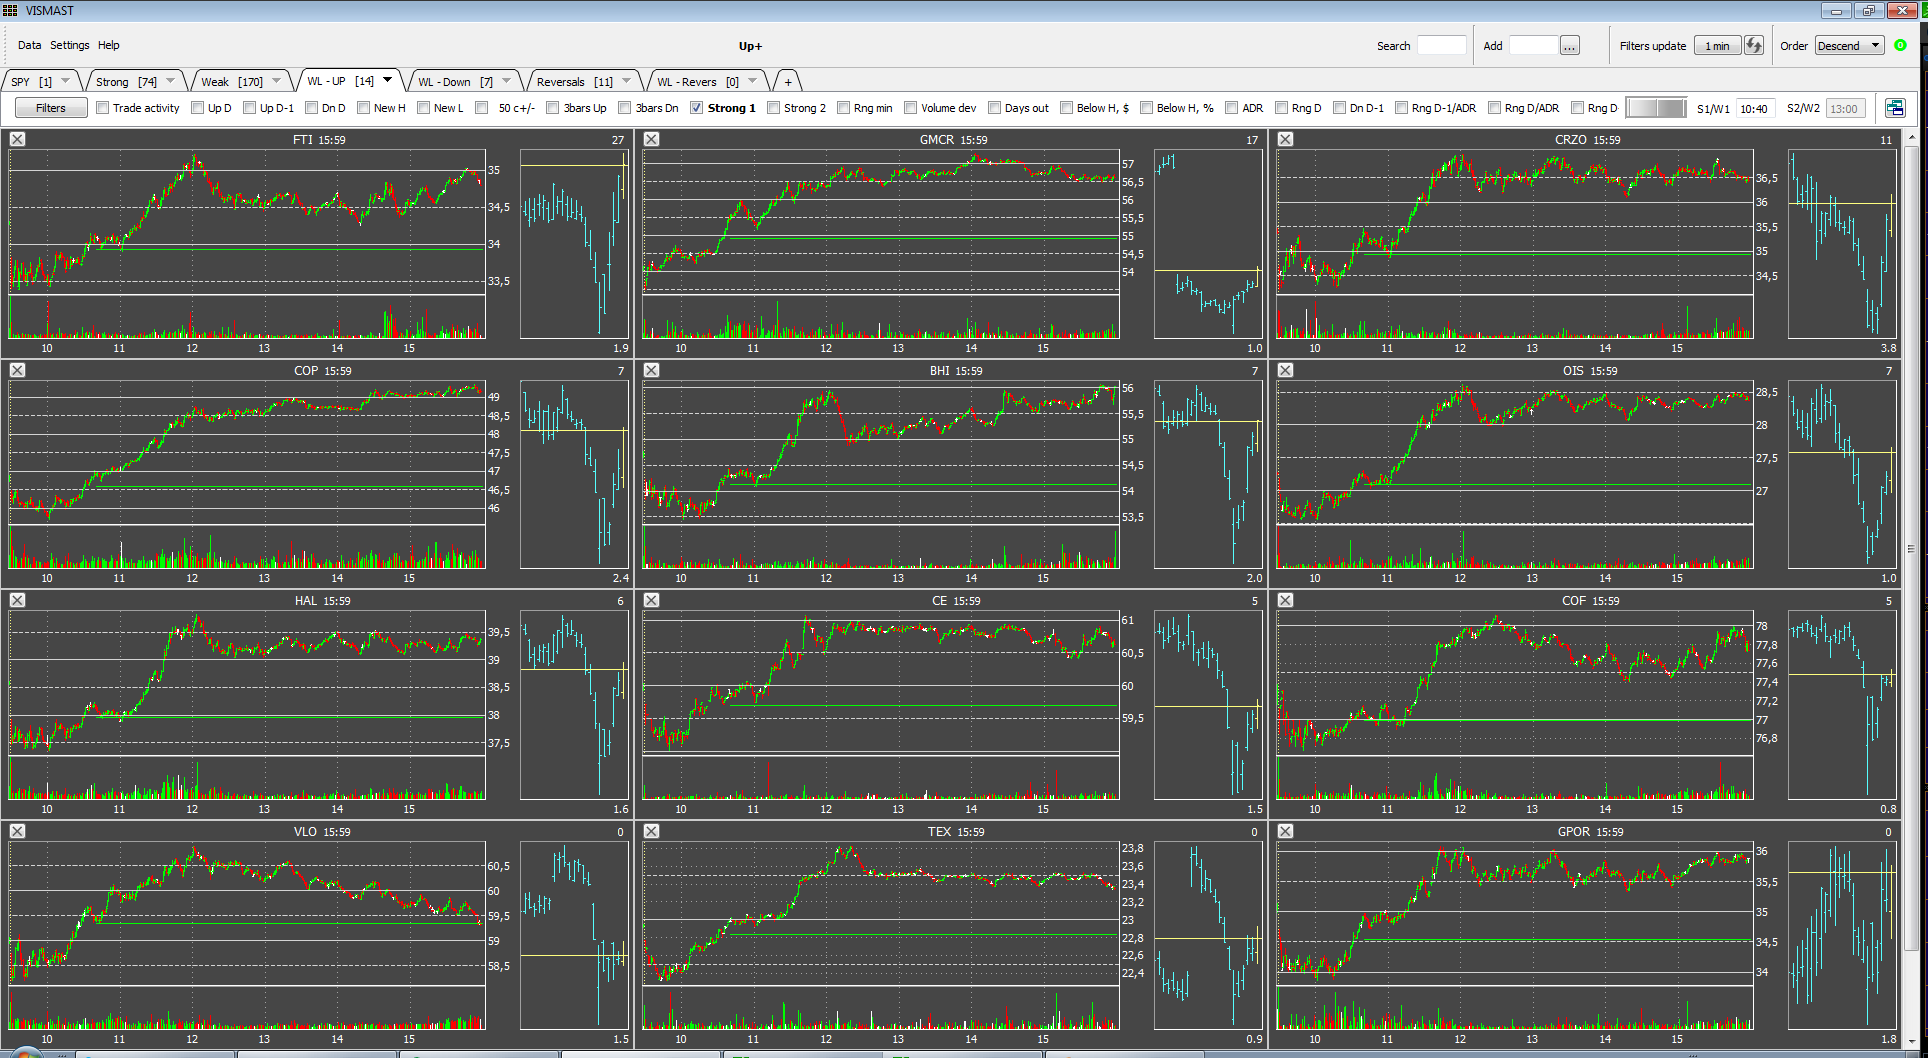
Only one trade for today - GPOR.
And as usually - some stocks didn`t trade (weren`t sufficiently clear for me - just now it is pretty clear how to trade them
 ), some stocks didn`t see in the right moment.
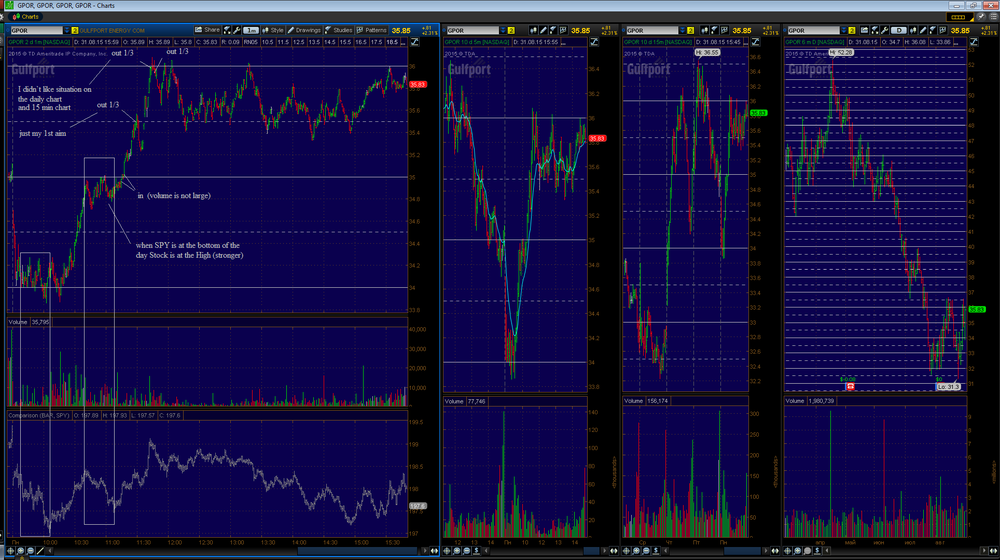
-
Today market was hard to trade:
- quick return after short movement from good consolidations on new daily high/low
- strong/weak stocks didn`t make good movement
- support/resistance levels with volumes in the basement were broken
- stocks for short moved within previous day`s range
When I see such situations I try to trade very cautiously.
-
Here are my two trades and strong stocks from my WL for today.
Note that your setup/pattern have to be pretty simple and clear for you. If there is no your signals simply don`t make a trade.
-
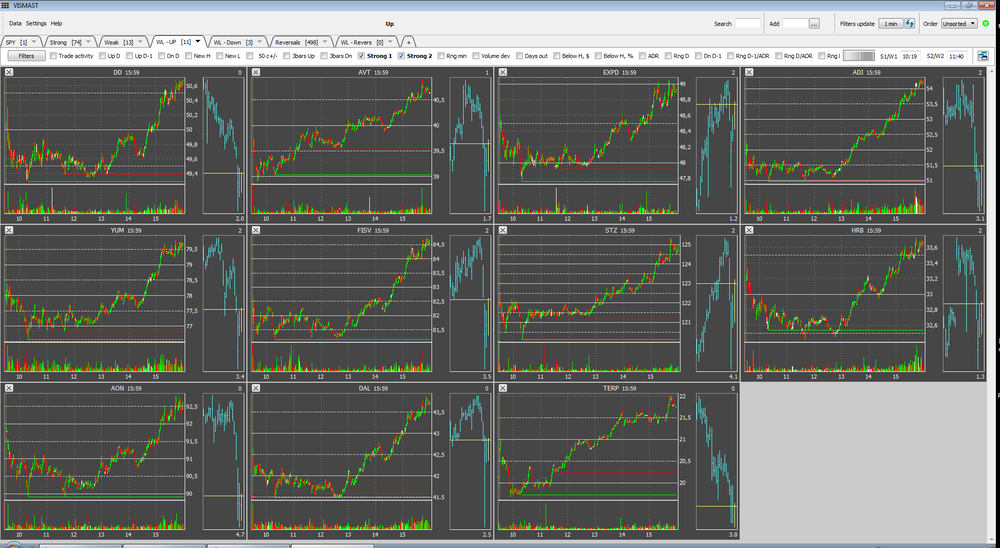
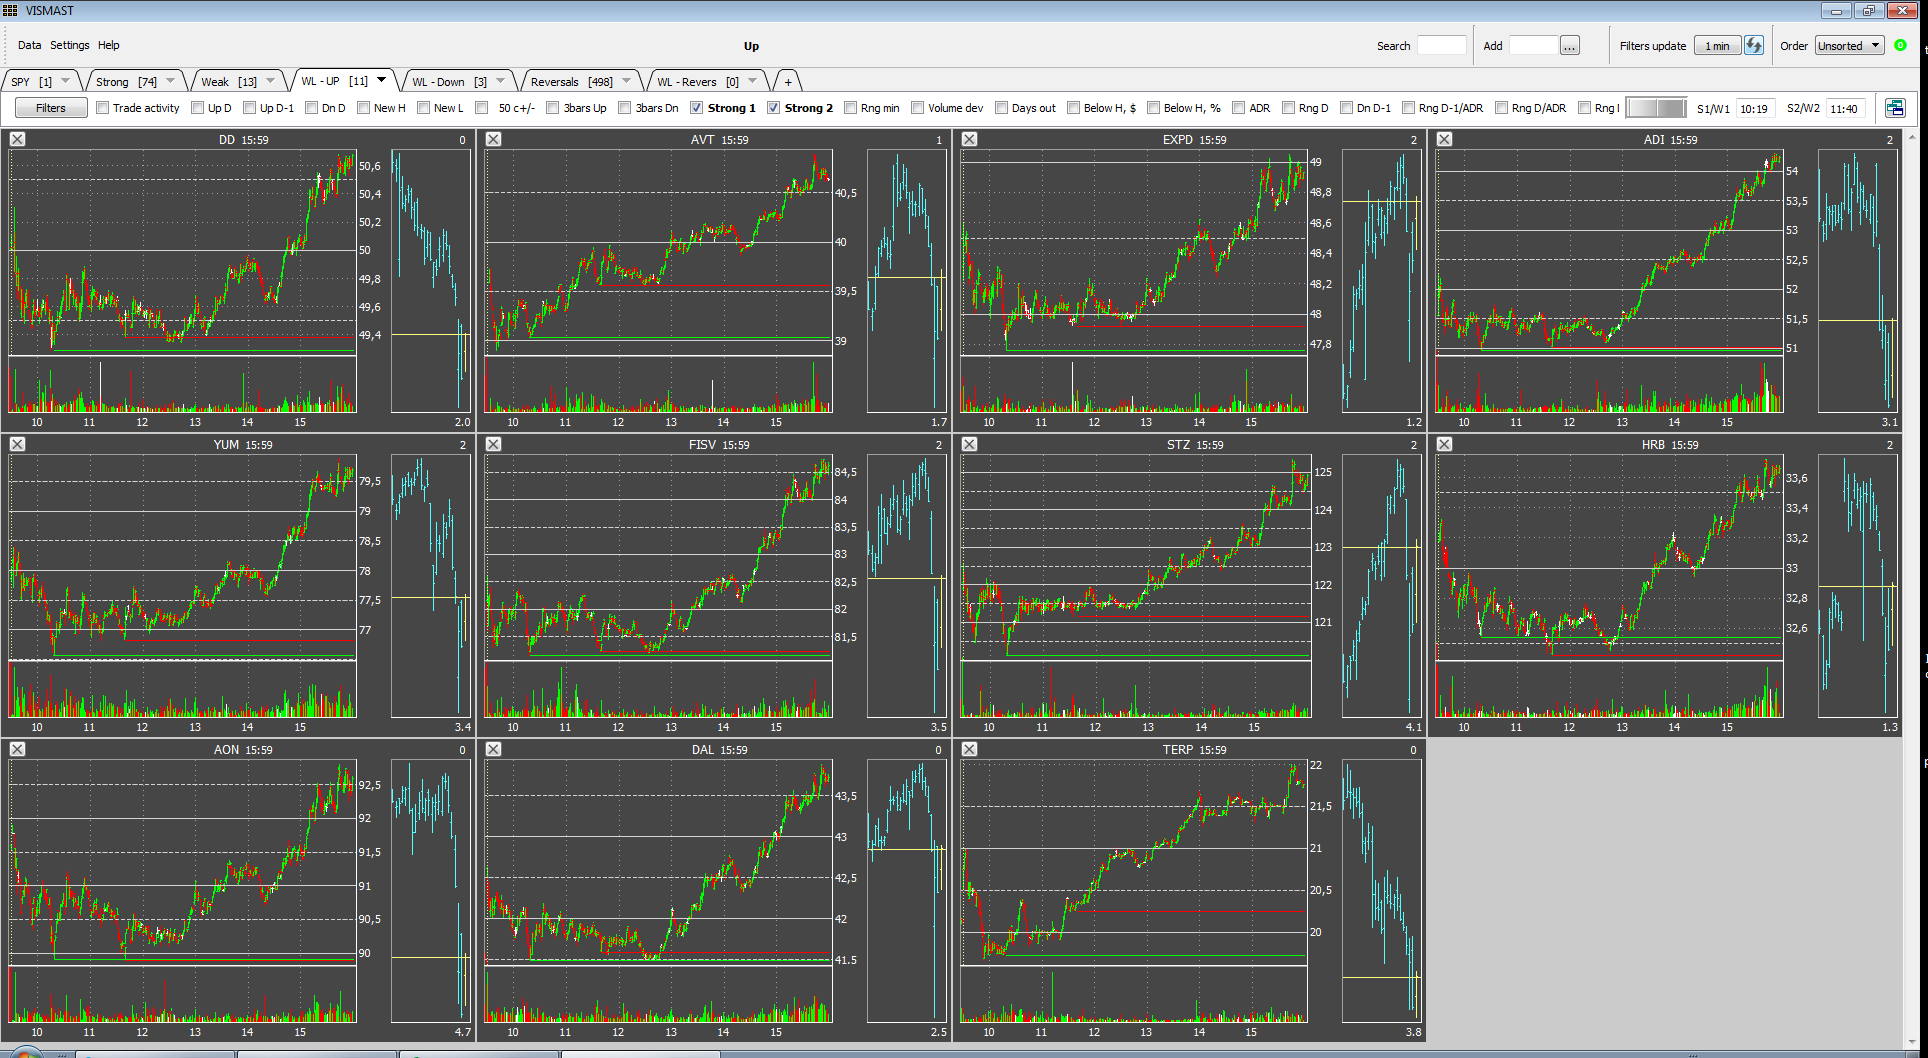
I finished main description of strategy.
Below strong/weak stocks that I had on my watch list for today (it was very productive day for search results and I used two strong filters). As you see all opportunities were very good today (it is not such situation every time). I traded STZ (stop loss was some more than I have usually) and EXPD only. I think using your software you can compare these stocks with SPY chart and analyse by yourself.
Strategy needs some patience from you especially when market always makes new lows/highs. For such moments I use more additional signals + look at quantity of strong/weak stocks (for today there was a lot of strong stocks).
-
How I find strong/weak stocks
There is one condition I didn`t say above - SPY (market/any other index) has to be volatile and move with some retracements/pullbacks. In other situation there is no reason to use this strategy.
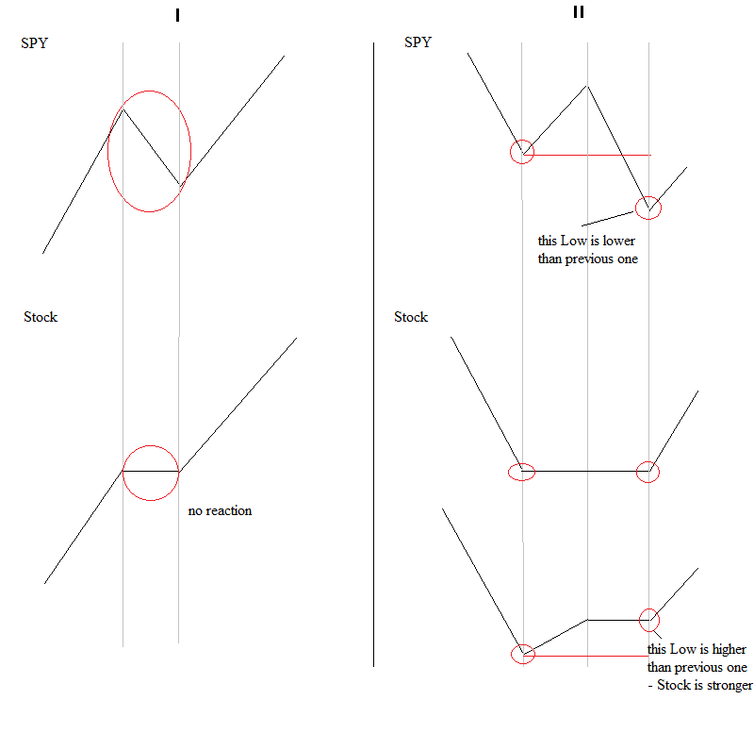
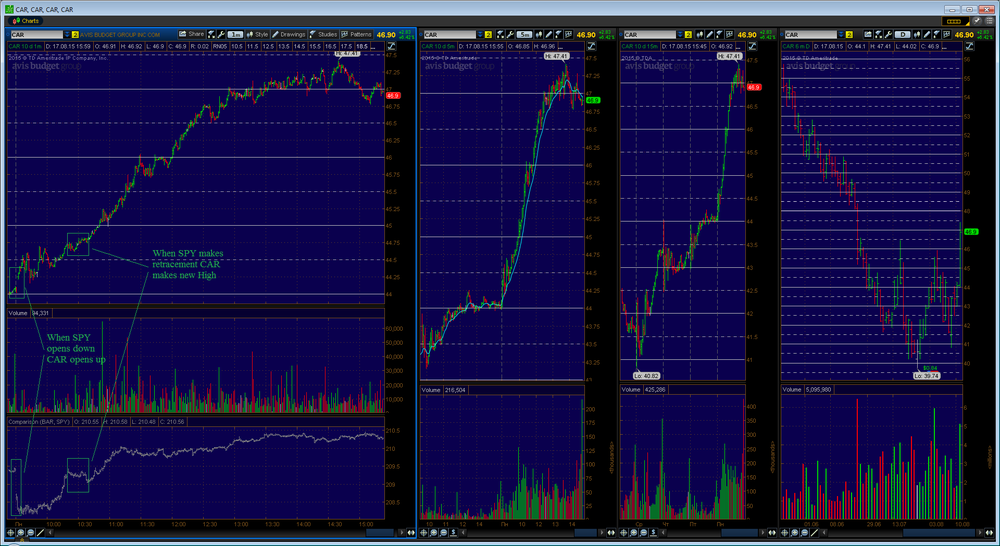
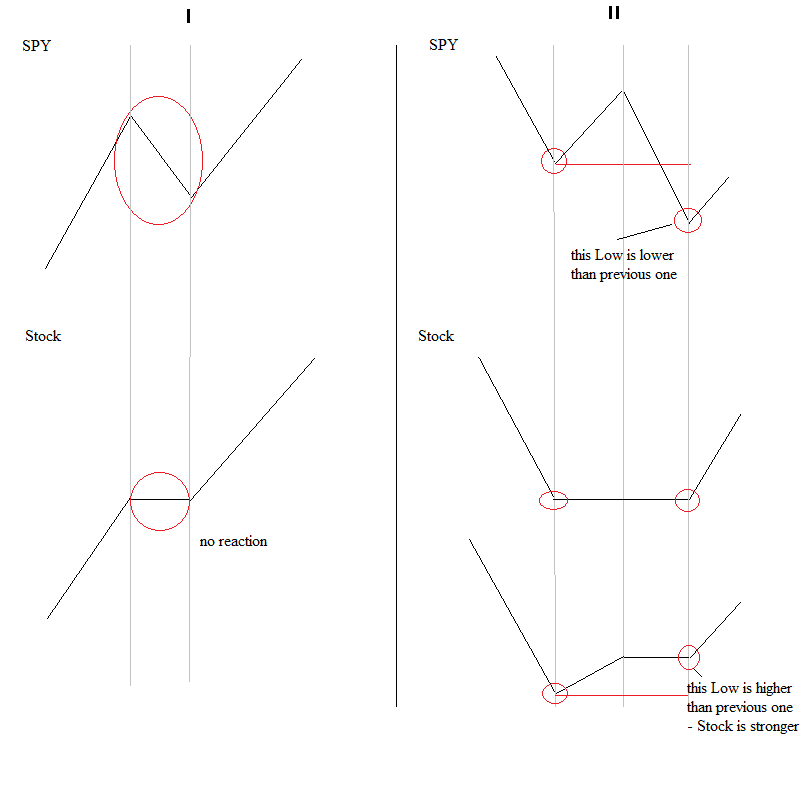
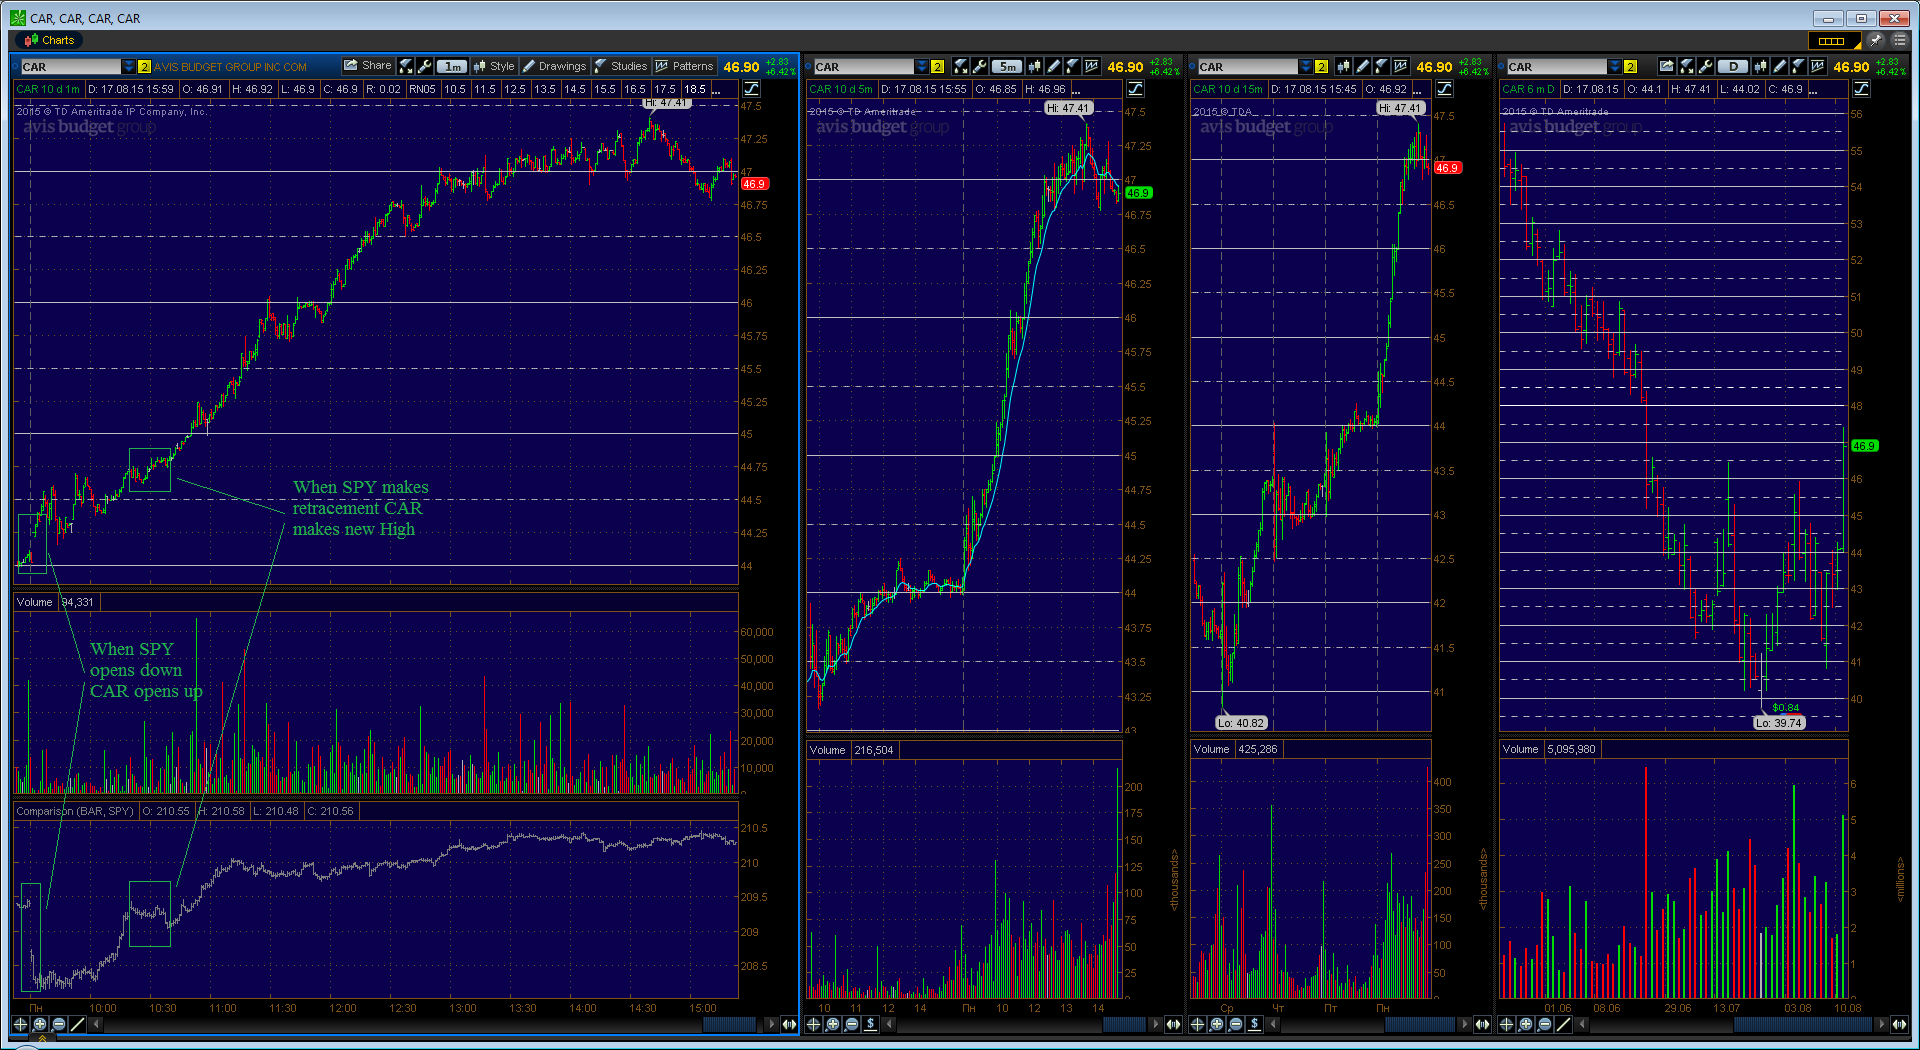
I use two methods to search strong/weak stocks (see attached picture with schemes):
1. When there is one wave: SPY makes retracement – Stock stays on one level. This situation usually used when SPY moves strongly in one direction with short retracements.
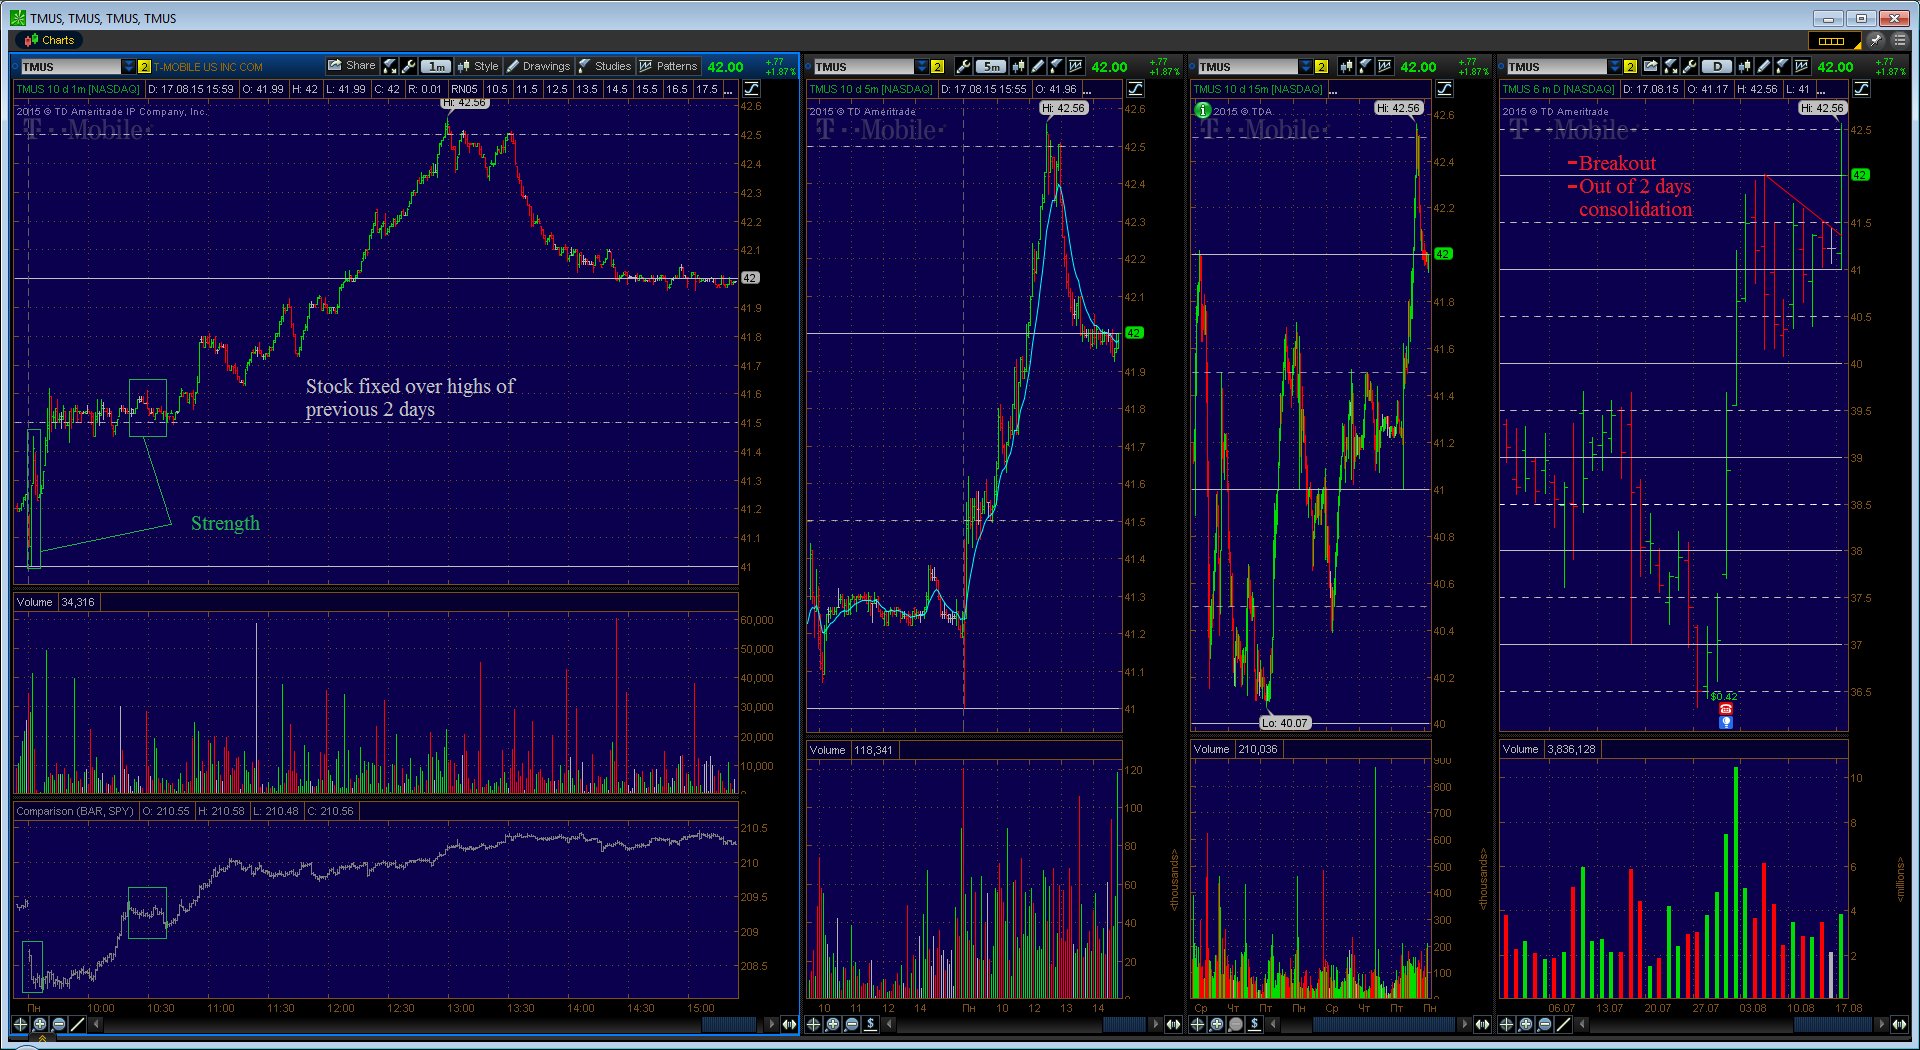
2. When SPY goes in one direction for a long time and each wave makes new high/low (situation in Friday was a good example).
During trading session (see Timing post) I try different methods and send stocks to my watch lists for further monitoring. Then I select the best ones for trade.
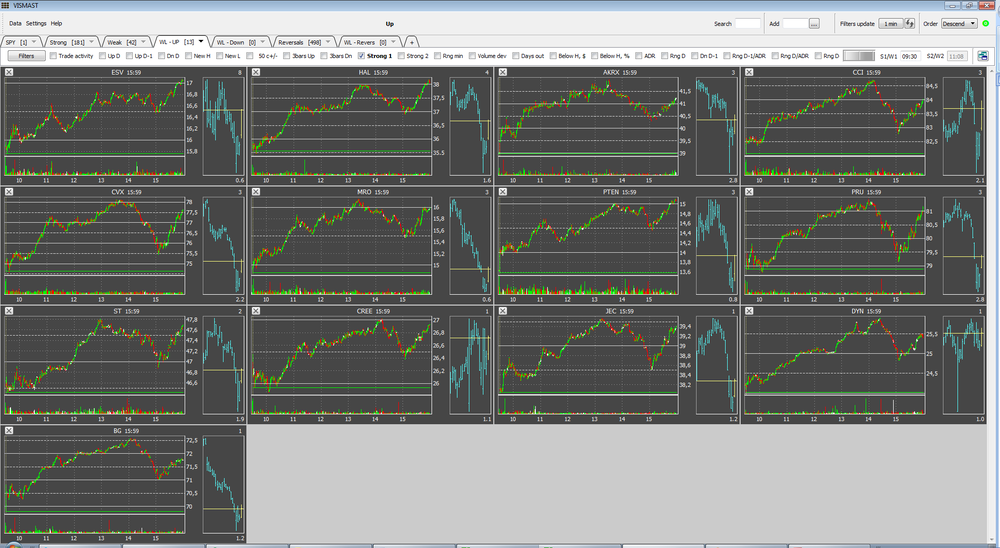
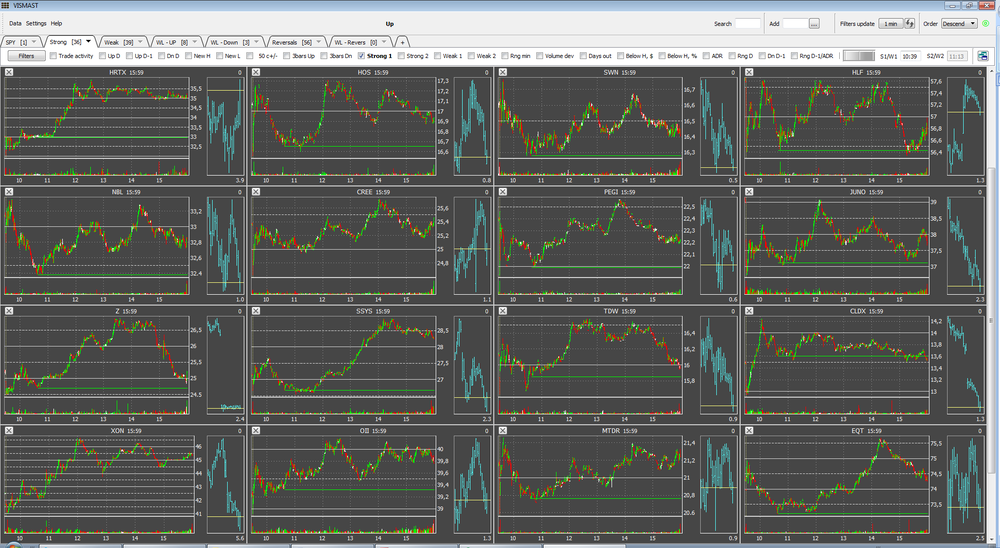
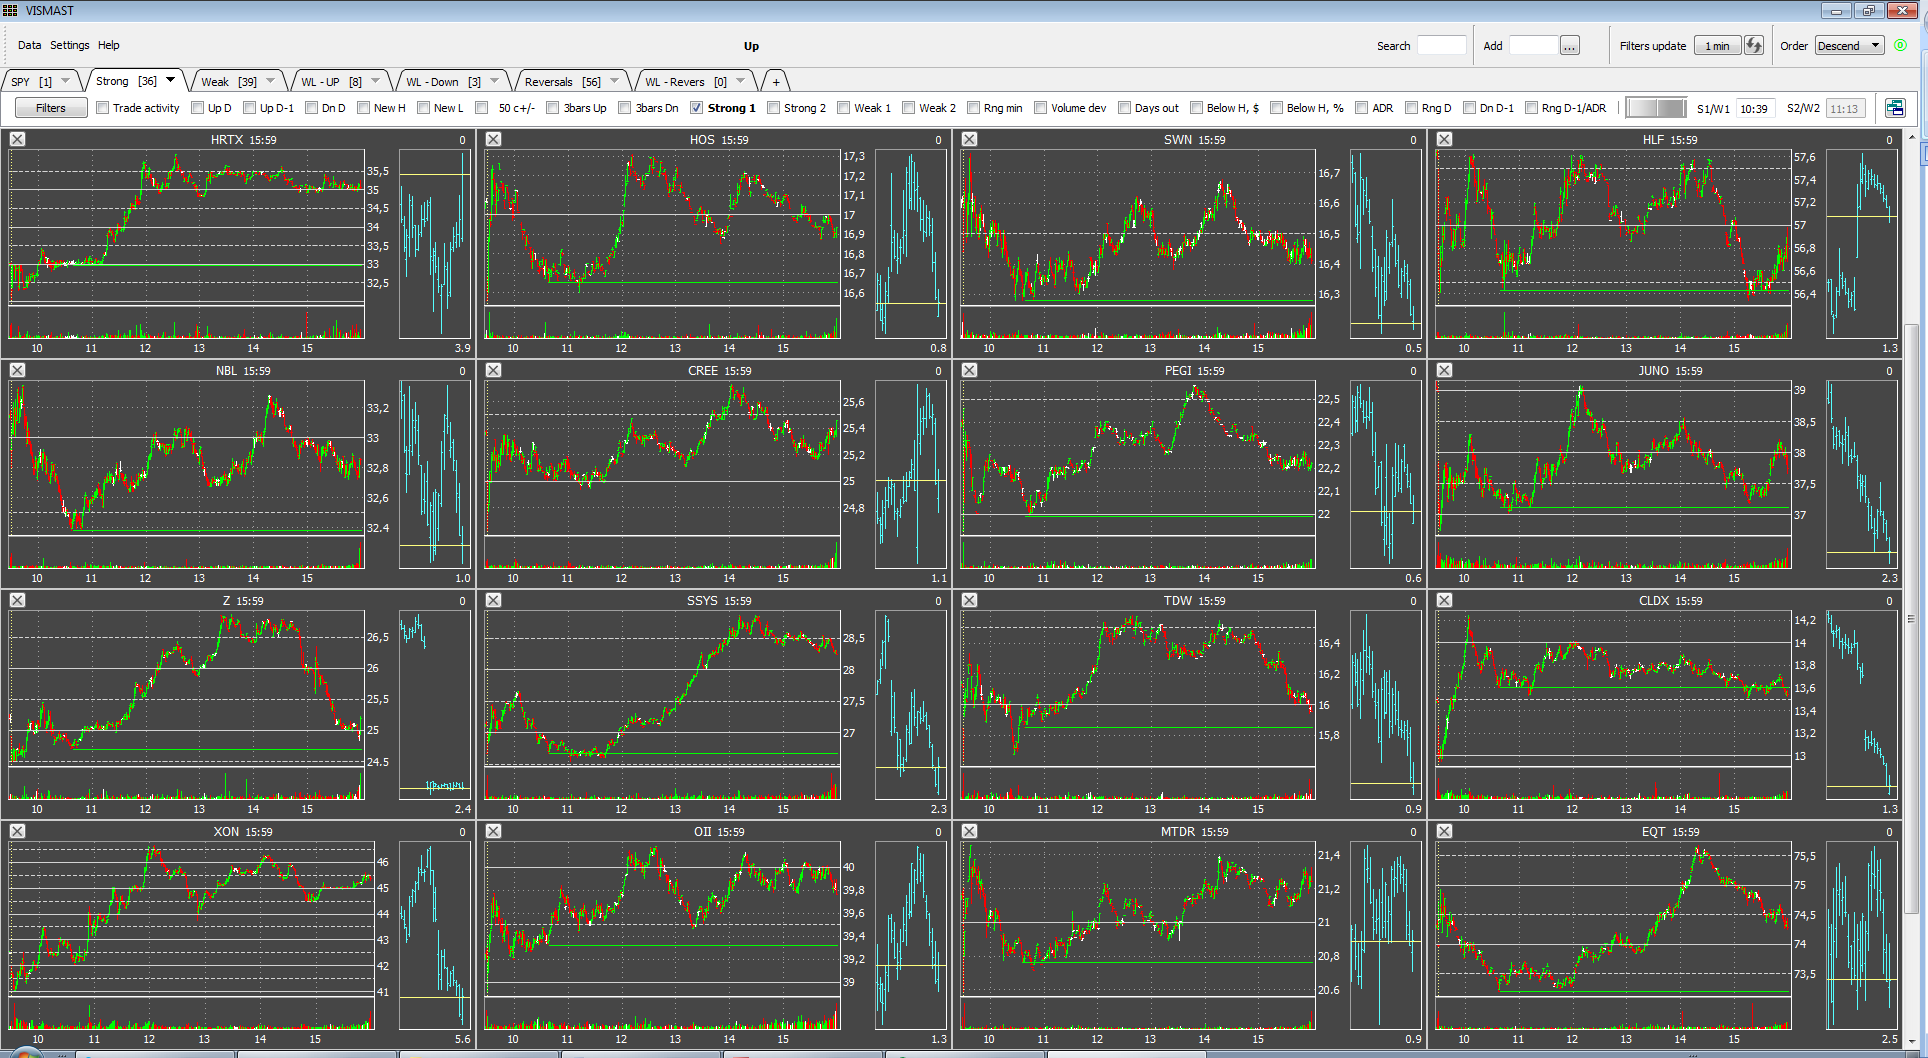
Technically I make search and monitoring in Vismast stock screener. Earlier I made custom filters in Thinkorswim/Strategy Desk and used Finviz elite + I monitored selected stocks using Thinkorswim`s multiple chart windows. Now I have more optimized process. Below I attached print screen with search results for strong stocks from 10:39 time period (I traded HRTX and Z from this results - additionally they were stronger from 9:30 + WEC - not in this print screen).
For intraday trends I use usually such main filters as:
- strong/weak: main filters for strategy.
- days out: I think that breakouts is good signals for strong movement. Broken level will activate stops and this will give more impulse.
- above low/below high: to find stocks near day low/high.
For reversals I use listed above filters and:
- sorting parameter Change from open: to find stocks with the biggest movements.
- rng D, rng D/ADR and rng D-1/ADR: to find abnormal big movements for today and yesterday.
Actually I use a lot of filters. I add more filters when there are a lot of stocks in results and less filters when there are poor results.
-
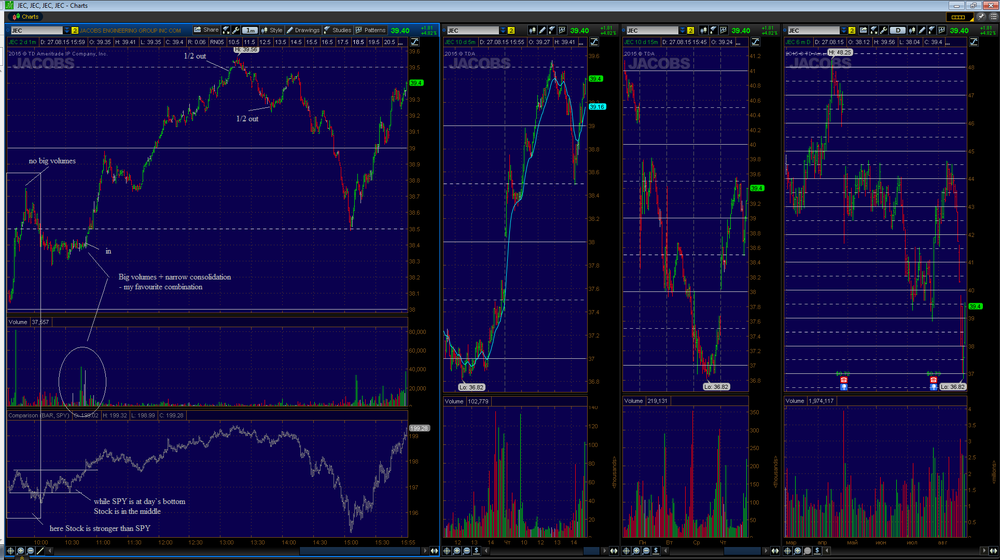
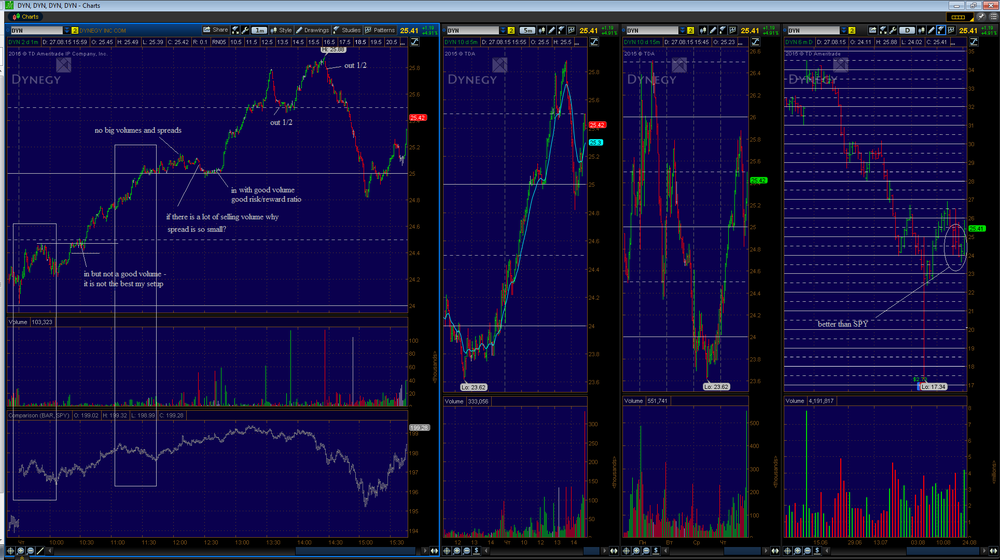
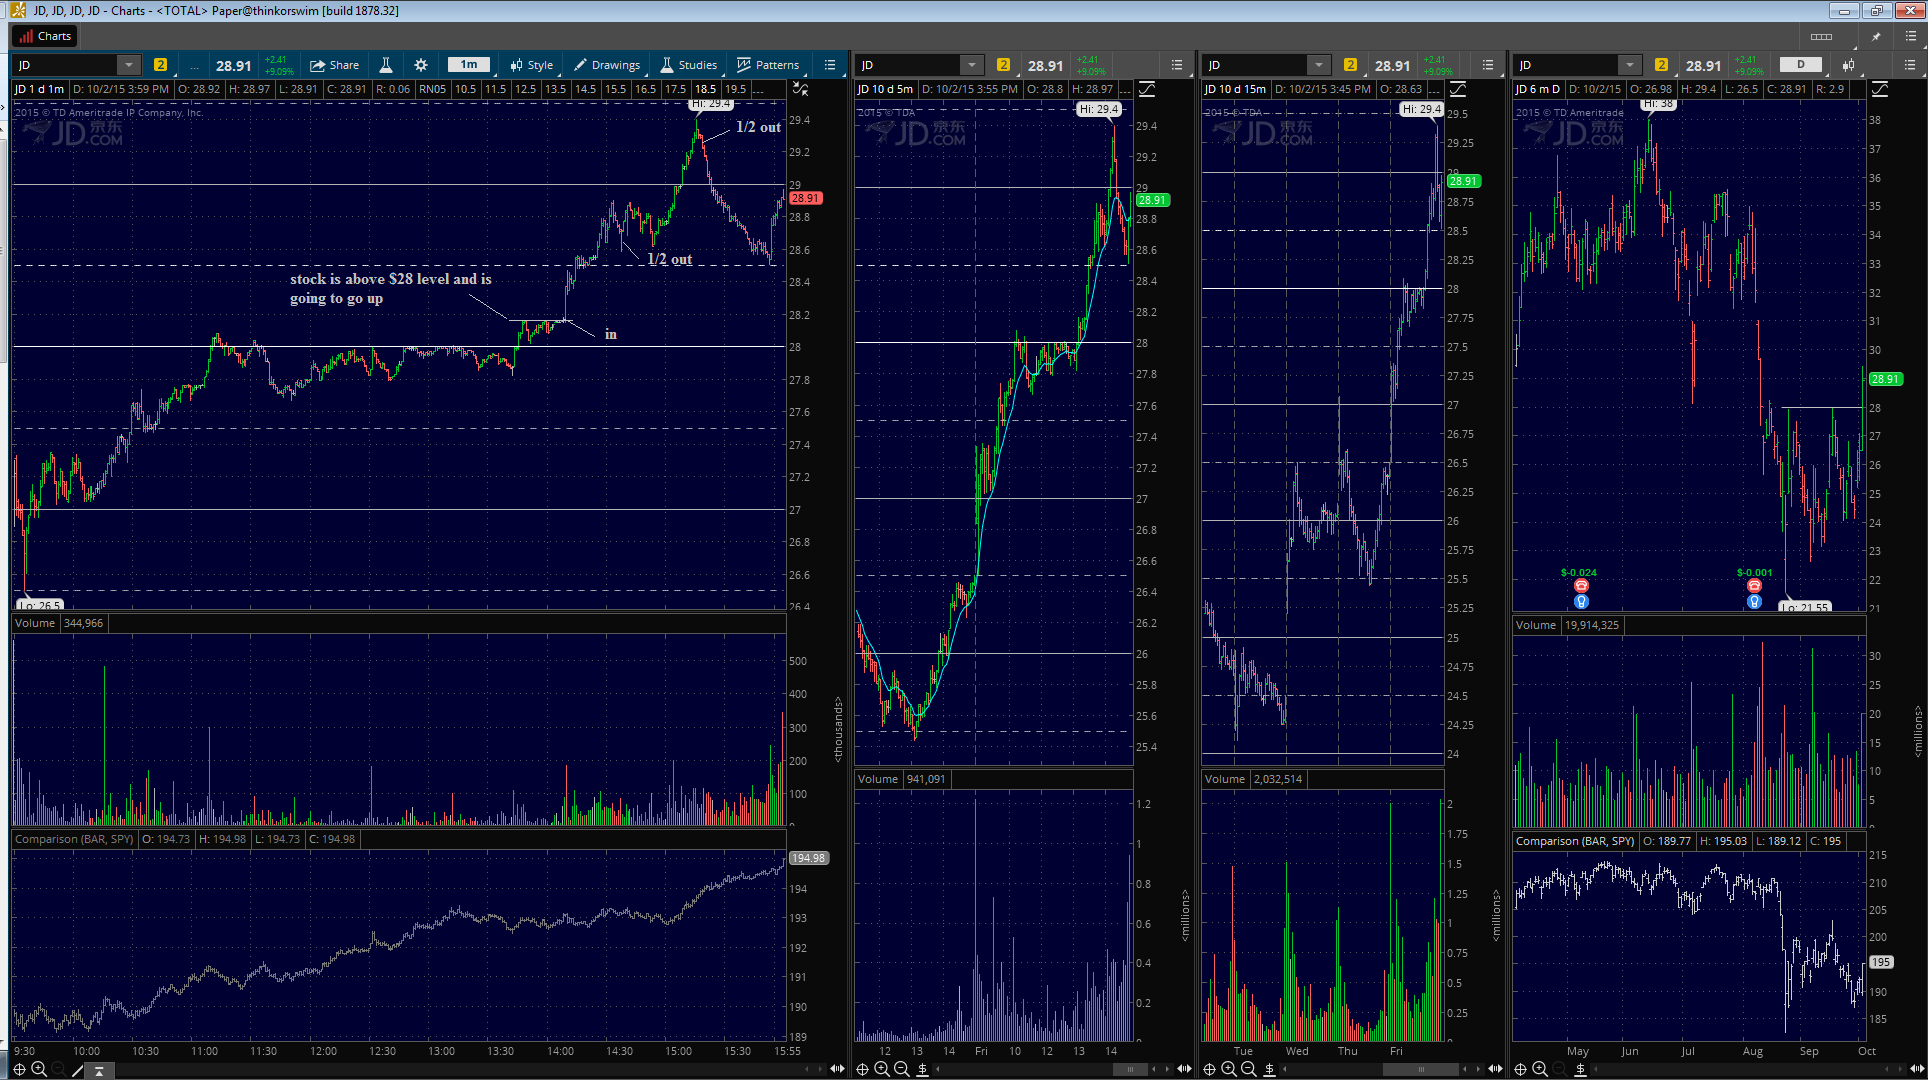
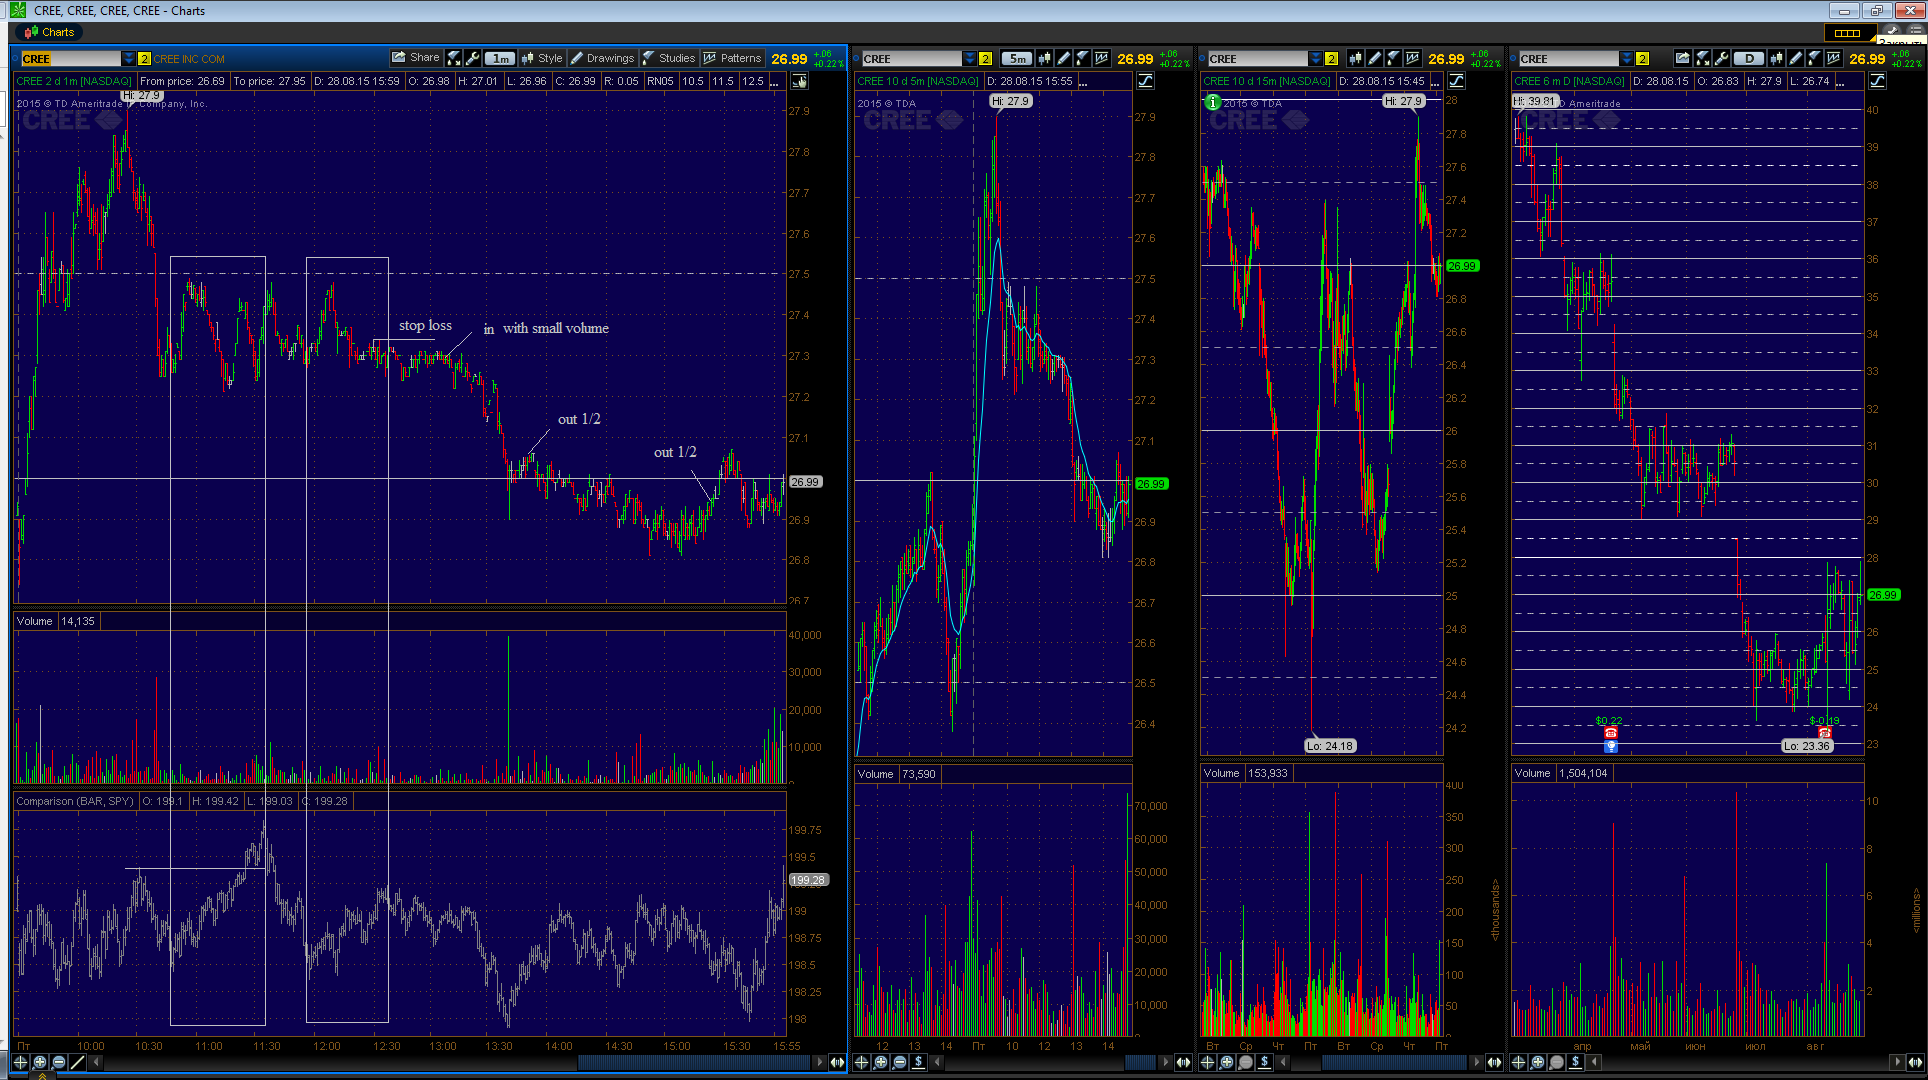
Enters:
1. when stock makes clear support/resistance level (big buyer/seller accumulates his position). Often there is no clear level and risk is very large (can be more than potential reward). In this case I have to wait for more comfortable risk/reward situation - narrow consolidations.
2. narrow consolidations (better with volume spikes in):
- when stocks starts to go up. It is consolidation before main movement (can be near high/low or in the middle of range).
- when stock makes new high/low. It is good situation because you can see that stock is under big buyer`s/seller`s control and there is strong movement.
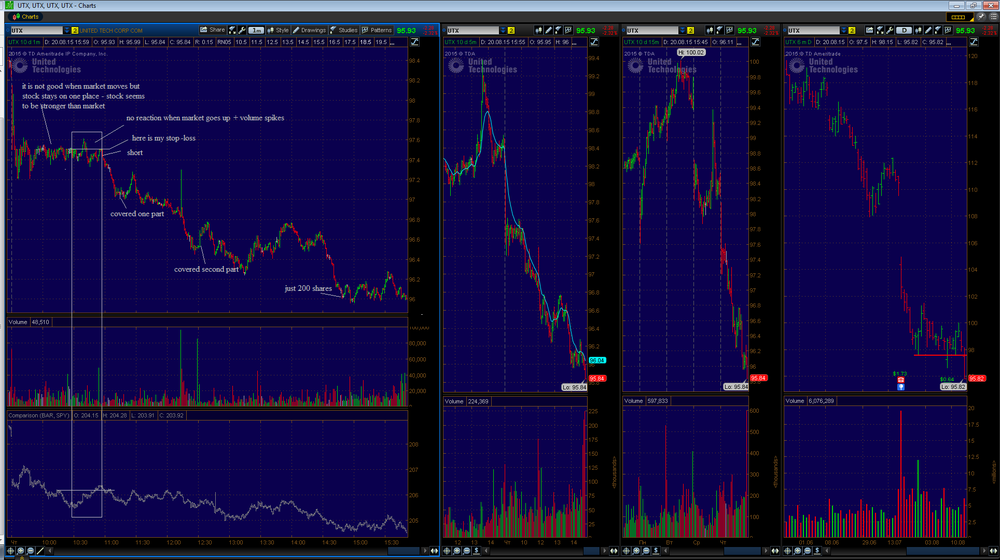
Exits:
One part - when stock makes 40-50c movement or/and at some level on daily chart. Other part - trailing stop or when there is volume spike on the day high/low with big spread.
I put stop-losses:
1. under/above some clear local support/resistance level
2. under/above bars with large volume (trailing stop)
3. if I am in plus and stock goes in opposite side I try to exit with a part and fix some profit.
-
3. Strength/weakness on daily chart. I am looking at what market made last days (minimum for yesterday) and it is good if our stock shows strength/weakness on daily chart also.
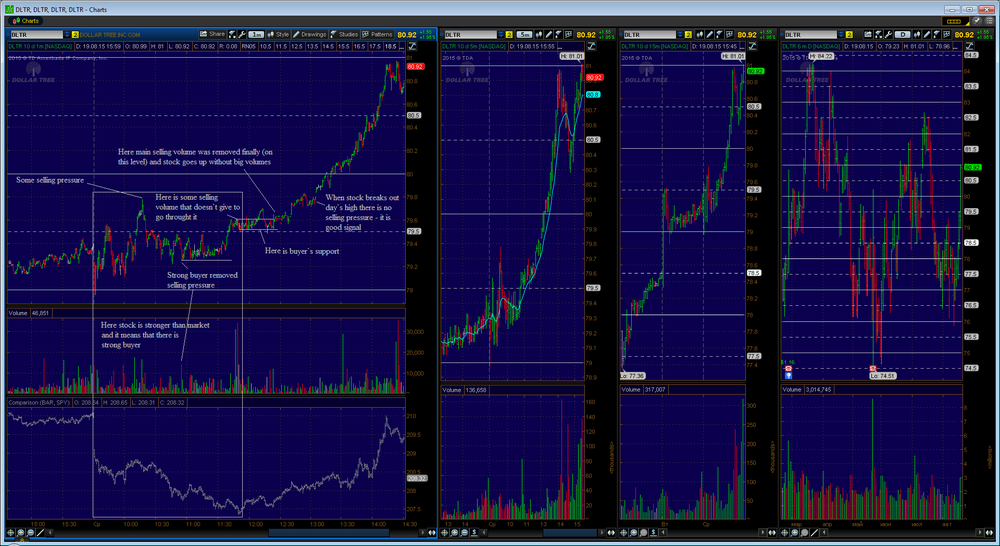
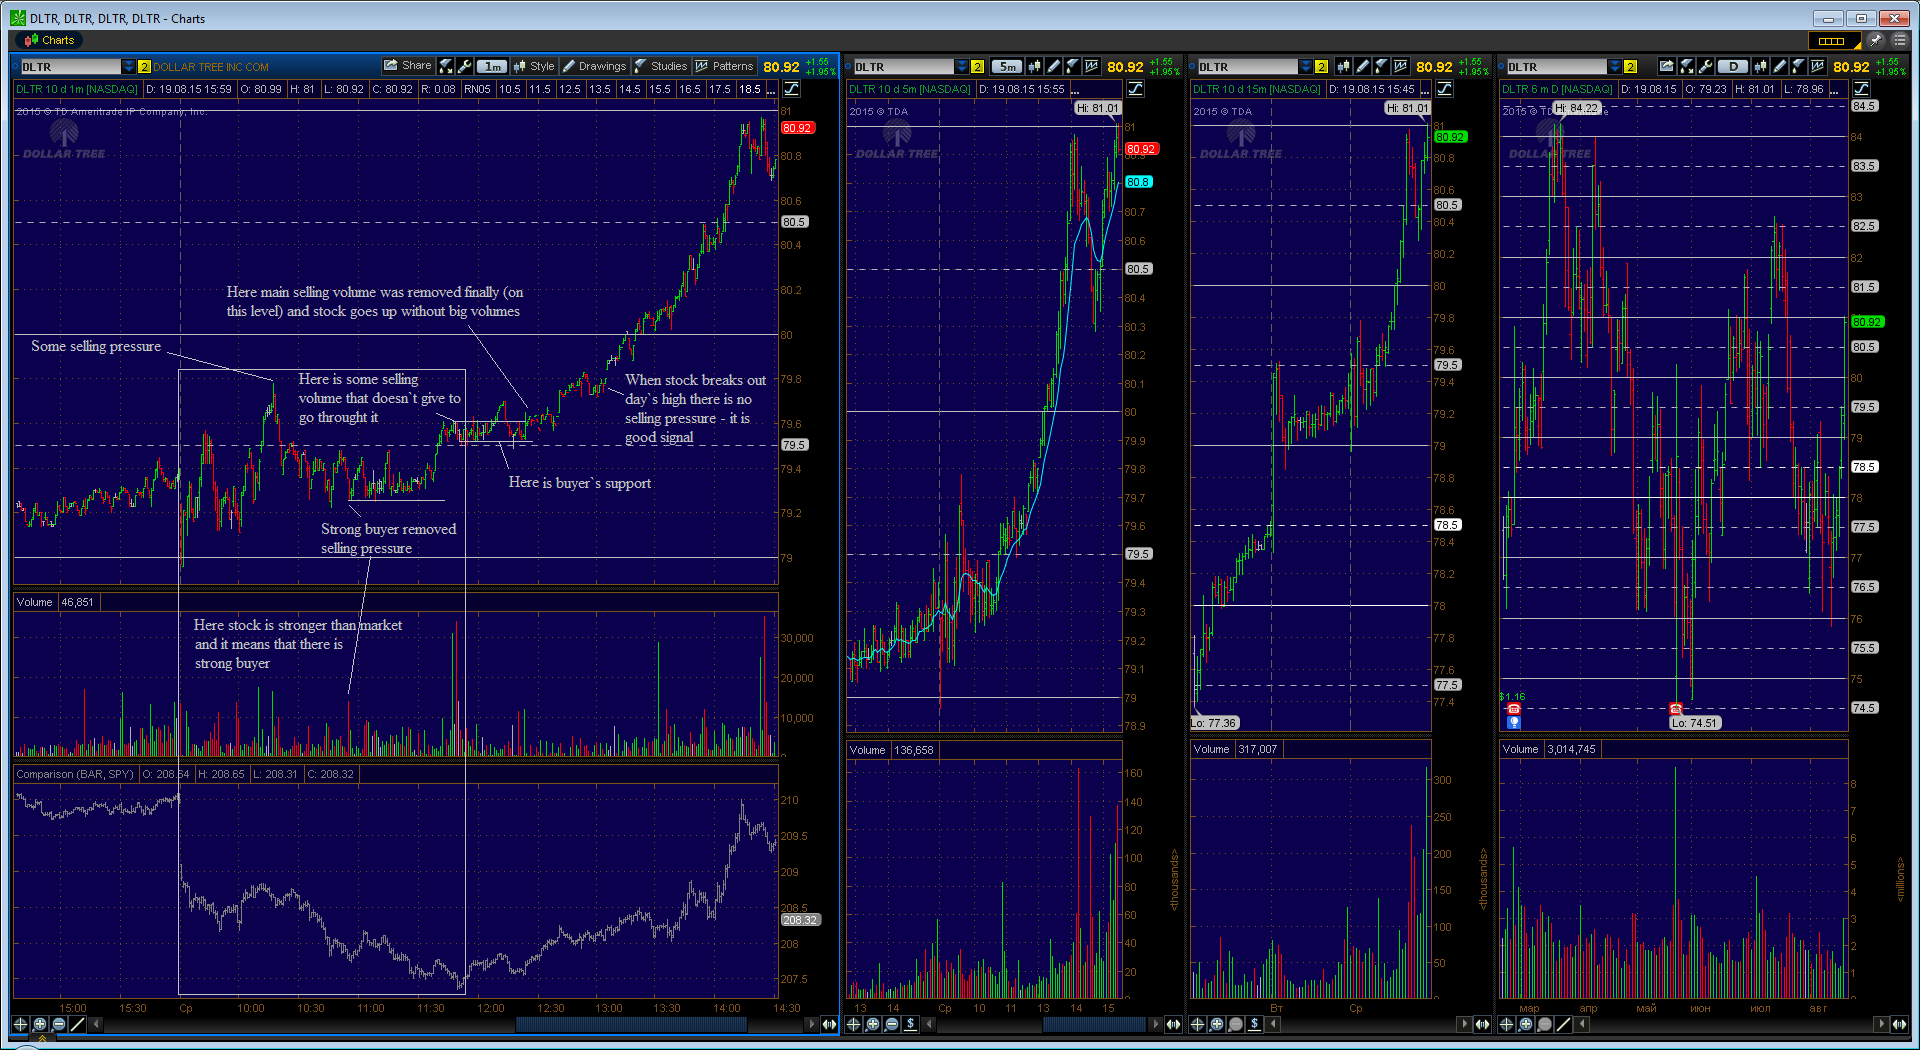
4. Volumes - buyers and sellers on chart
There are buyers and sellers only and chart is the visual track of their behavior in some period of time.
Let`s look further at buyer`s side only (for sellers the meaning is the same).
There are situations when stock is in some range and then large volume gets out and chart moves strongly in one direction. What it means for me: there was some balance between buyers and sellers in range (buying volume = selling volume) and no one of big buyers or sellers didn`t have interest in this time. Then one big buyer (maybe there are two or more of them) buys out main sellers` offers in one or two prints (here is volume spike) and after that we have situation when buyers are more than sellers. Then stock goes strongly up till meets another equivalent of selling volume/pressure. More disbalance - bigger movement. What if chart doesn`t move anywhere after volume spike? It is simple - there is great amount of selling volume. Sometimes buyer has to make few impacts to clean main selling volume (if selling volume is big).
How to understand that situation is under big buyer`s control? After volume spikes there is no opposite movement (or it is short and without big volumes), big buyer will execute all selling orders making local support levels. Also we will see it during impulse/movement - when buyers will meet sellers` pressure he will buy all amount of selling volume (again volume spikes). If big buyer desires to buy more shares quickly it will be very aggressive. Sometimes when market moves much time in opposite direction and selling volume is more than big buyer can afford, he may leave his support level or make some different level. If I see two volume spikes without retracements below bars` low (bars with volume spikes) one after another - stock is under buyer`s control.
The best situation – when two bars with volume spikes make local support level in consolidation.
There are often situations when I can`t understand what buyers and sellers make. Then I don`t trade this stocks.
More additional signals - more chances to have a good trade.
-
Situations when our stock`s strength/weakness pattern became more reliable:
1. More than one situation when stock demonstrates it`s strength/weakness - pic. 1.
2. When there is strong daily level - pic. 2
To be continued.
P.S. Friends, if you have any fresh examples you are welcome.
-
My goal
My goal is to catch minimum 40-50c of stock`s movement with about 10-15c risk.
Other conditions even if risk/reward is the same are not comfortable for me (for example trading with 50c risk).
I think it is from my character: I am a "middle distance runner". At school I had poor results in 30-100m running and I liked 500 and 3000m distances. And it is the same in other fields of life and in trading. For example I can`t psychologically use short scalping style as my friends do it easily.
Timing
I don` trade first 30 minutes. As I said above I am not so fast to trade in this time.
Also I don`t trade (involve in trade) 1-1.5 hour before and all session time after FOMS minutes.
Best time for me is after first 30-45 minutes when there is enough information to make a trade and a lot of potential for stock`s movement.
Last good enter point for me is at about 14-00. At this time stock can continue it`s first movement (or previous strong impulse) in current day (in launch time before 14.00 stocks can be choppy and trade in some range without direction).
Sometimes it is good time to make reversal trade at 15.00 (but not after 15.30) if stock moved in one direction all day with unusual daily range without retracements. Note that it is dangerous strategy because stock can trade in one direction till market close easily. This trade needs some additional evidence - tape signals, looking for market`s behavior.
-
Some words about me
Finally I selected daytrading, US stocks and chart reading. As I see now my choice is easy but it was difficult as I tried different styles and instruments for a long period.
Why daytrading - because I am afraid of gaps and it is more comfortable for me to control all risks.
Why US Stocks - I can`t concentrate on one or few instruments (futures or currencies). When there is no any trade idea (my pattern) for a long time my mind starts to find them by itself. It is more comfortable to choose patterns that are clear for me and then search stocks with this patterns. Thus I search stocks with clear patterns - not patterns in selected stocks. I like when there are a lot of opportunities and I can select the best one that is comfortable for me. Other side of such way - needs a lot of search work.
Why charts - I don`t have quick mind and reaction to work only with Level 2 and tape. I see some tips in tape and think that it is very powerful trader`s instrument. I look at tape before pushing buy/sell button but, to be honest, main decisions I make using charts and I quickly become tired watching tape for a long time. I admire people that can create all picture using tape - their "brain-processors" are very fast - and they easily can make fast trades. Additionally charts give all picture and opportunity to work with great amount of US stocks.
I didn`t consider indicators as EMAs, MACD, candlesticks and the same ones because they don`t give any information about buyers/sellers for me.
-
Hello.
I am individual home trader. I trade US stocks. I like to trade alone and don`t teach anybody. English is not my native language and I am sorry if some sentences are not clear.
In this thread I want to share with simple and working strategy and my thoughts about daytrading. As I find time I am going to write about my daytrading style, timing, volumes, what and how to search, maybe something more (now I don`t know exactly). Maybe it will be useful for someone.
To make examples I will use my old pictures (from my individual archive) and latest ones.
Let`s start.
At first glance Strong/weak stocks strategy is quite simple - I compare stocks with SPY (indicator of stock market for me). Look at attached pictures (down chart is SPY). Find such stocks and make money easily. But there are not always such clear setups and to have more chances we need to say about some nuances.
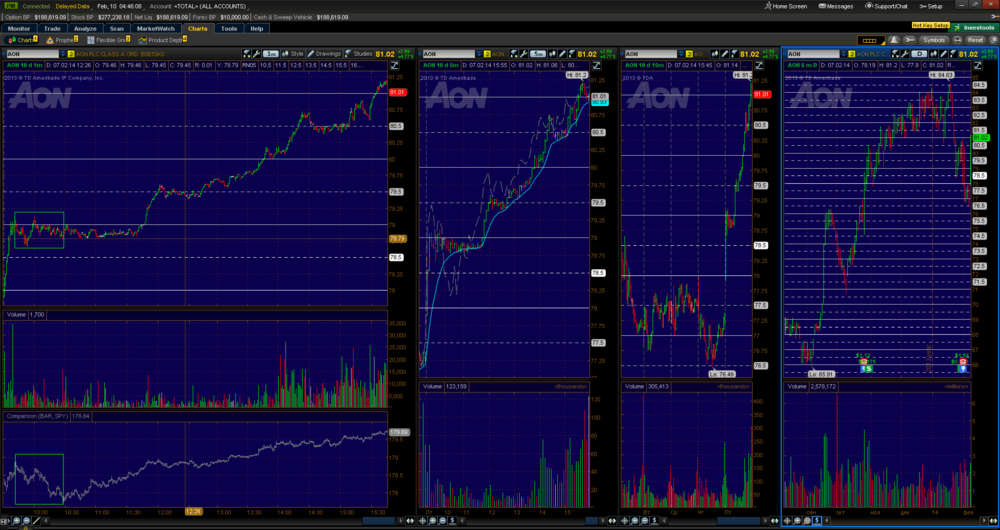
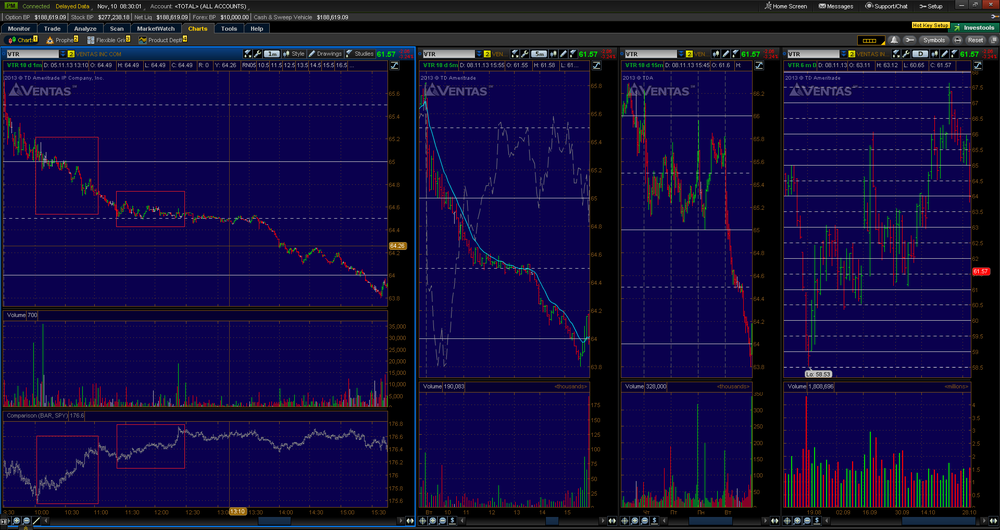


Strong/Weak Stocks Daytrading Strategy - My Style
in Day Trading and Scalping
Posted
This is why it is better not to trade during FOMS minutes (for newbie traders;)).