
Welcome to the new Traders Laboratory! Please bear with us as we finish the migration over the next few days. If you find any issues, want to leave feedback, get in touch with us, or offer suggestions please post to the Support forum here.


zt379
-
Content Count
42 -
Joined
-
Last visited
Posts posted by zt379
-
-
The idea of the drill was to show two different types of VEs.Firstly, my apologies for the questions about the P2.
I just wasn't sure about it but now understand, so thank you,
and as you say, your drill was about VE differentiation.
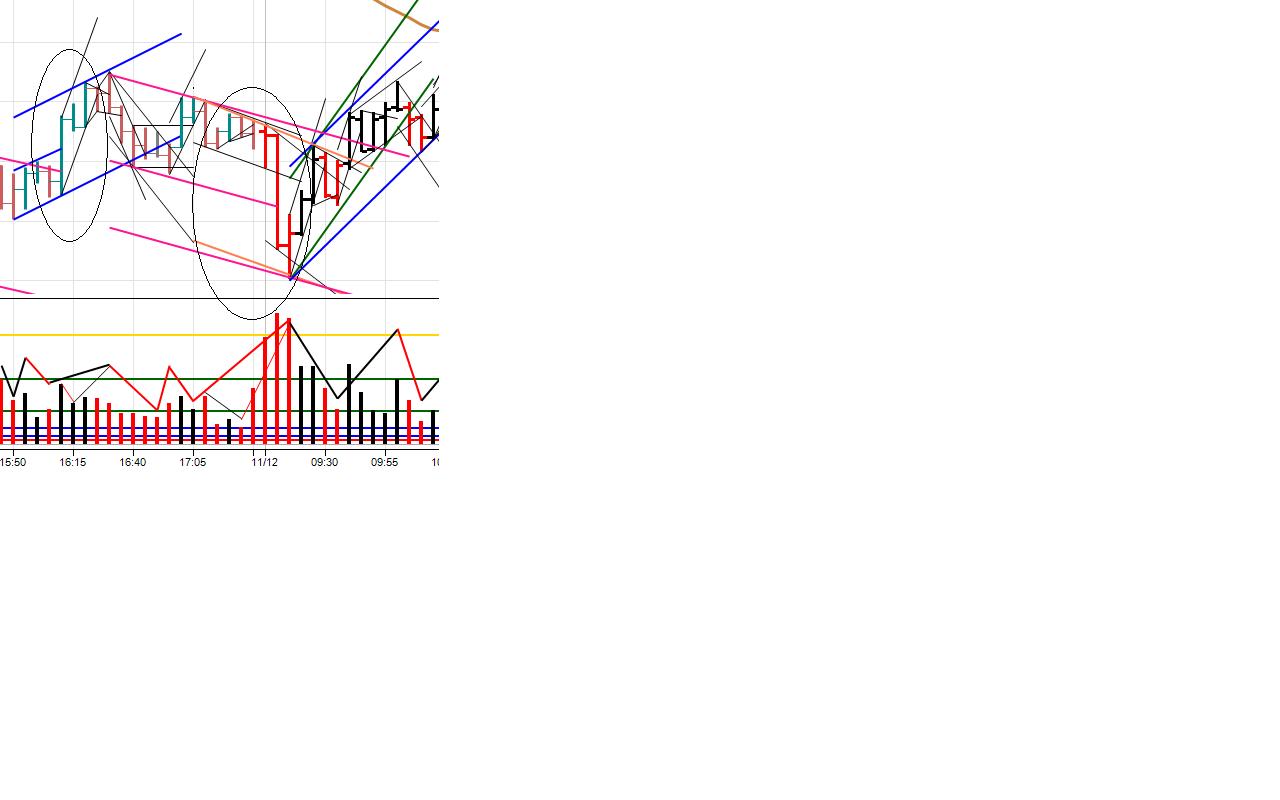
One more thing. The first oval is an acceleration of an actual traverse. The second one includes a faster fractal traverse in addition to the last sequence of the actual traverse.
I am still digesting all this.
Your willingness to impart any fraction of insight is greatly appreciated gucci and by default
the same to Spydertrader.
The market doesn’t care about how we arbitrarily chunk the flow, i.e You just have to keep up with the sequences."chunk the flow".
 I love it. I might use it as a new user name
 Seriously though.
I'm getting light bulbs going off in my head..
thx
You are trying to squeeze the market into some kind of a mold.
As above, I think you've explained a part of the problem I've had with this method for some time.
Thinking that we needed some sort of criteria like as you say a mold so that we knew what we had and how to build things.
Like a brick looks like this and these bricks build a house etc...
and incorrectly that a brick will always be the same.?
Would I be close to say the only mold we really need is to recognize dominance and non-dominance wrapped up in lines so we know where our P's are and an FTT to start/end the thing at the right bar ?
http://www.elitetrader.com/vb/attachment.php?s=&postid=2210216
Oh My .....more light bulbs......!!!!!!!!!!!!
thx gucci
-
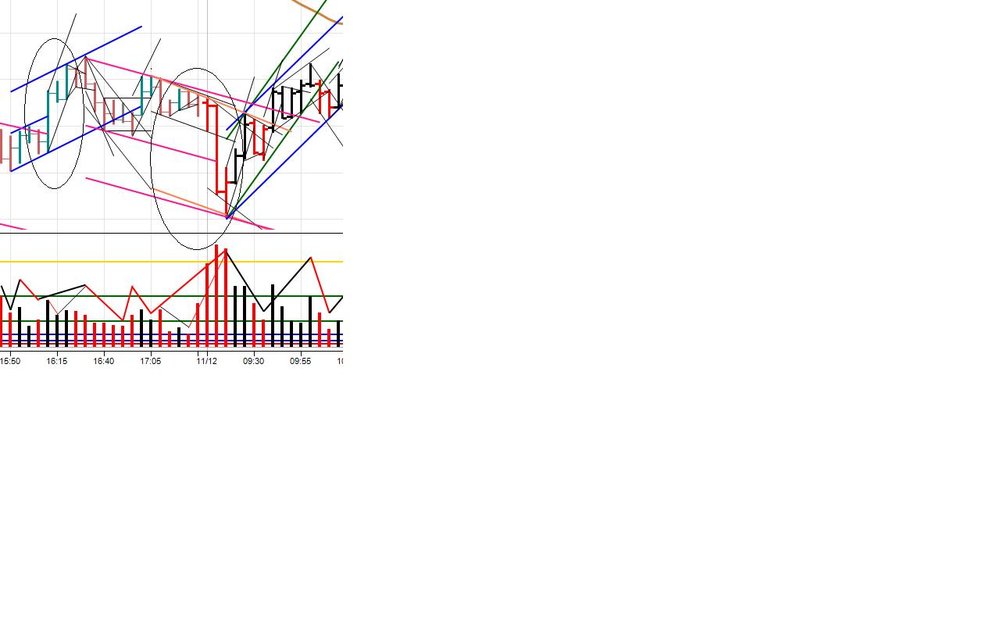
Look at 15:50 bar closely. You’ve got an IBGS on decreasing volume. What transpired on this bar? The market stopped moving from right to left (after it completed all of the sequences on every fractal of the prior trend) and started moving from left to right on decreasing volume. What else do you need? You can verify this by going to a smaller time frame. On a smaller time frame you will be able to place your B2B after our point 1. The market doesn’t care about how we arbitrarily chunk the flow, i.e 5min, 2 min or any other time frame. You just have to keep up with the sequences.It is not inside. The CLOSE of the BAR is inside, but the point 2 is outside.
Thx for your efforts in replying gucci, it's greatly appreciated.
I didn't know that about a P2 not needing to close outside an RTL.
I will have to take that on board in respect of what an FBO and fanning the previous down RTL
(Magenta) would mean.
Also, if you're able to help.
I'm confused about the new P3, having Ve'd.
I presume the new P3 is on the 16:20bar?
However, if so, I thought the 2R leg for medium (the 16.15 bar), because medium level Ve'd at 16.10,
needed to be in it's own container (even if only a one bar container) to get to the new P3 ?
If 2R does need to be in it's own container and so 16:25 is the 2R then how do we return to black dominance at 16.30,
to complete the last medium black, without increasing black volume ?
Continued thanks...
-
Find the differences. Enjoy.I don't understand how the B2B can start prior to 15.50 ?
ie: you have a B2B starting before your Blue P1 at 15.50 ?
I also don't understand how Blue P2 at 15.50/55 can be inside the Magenta RTL ?
Thx
-
Sorry, I must be missing your meaning. Our gaussians are different, as I put the 2b on the first ob of the container. Why would the 2nd ob be the (properly annotated) 2b?Thanks for your help.
moosie
This is my take if it helps..
(I stand corrected by those that know better)...
hth
15_10_2010.thumb.jpg.609b380c5ac2e96abe27ae2599c01447.jpg)
-
gucciIf I may ask, to see if I'm getting on the same page.
Would you agree with the remainder of the 15th from 10.30 onwards?
(the Blue/Magenta and Blue).
Many thx
I've coloured the Traverse containers Magenta/Blue to be relative to each other.
This is for the purpose of creating a "thing".
A magenta thing and blue thing.
We know we have a Channel P1 at 10:30,
there for the Channel P2 (which would normally be at the end of the Blue container)
needs to be outside the previous down Channel RTL.
I've lost the carry over annotations so can't recall if the previous down Channel LTL VE'd
and if so then where that previous down Channel RTL is.
Regardless, if the end of the blue from 10:30 gets us to a Channel P2 that is
outside previous down channel RTL then fine.
If it does not then fine, because we then know the blue from 10:30 and magenta from 11:40 and last Blue from 14:05 are actually all faster things building the Blue.
Which would get us to Channel P2.
Hope that makes sense.
-
gucci
If I may ask, to see if I'm getting on the same page.
Would you agree with the remainder of the 15th from 10.30 onwards?
(the Blue/Magenta and Blue).
Many thx
15_10_2010.thumb.jpg.8d2d322703a83a0b5d945816de190bc7.jpg)
-
Note how you just omitted to mention VE in your second quote highlited bold and still want it to express the same as the bold stuff in the first quote.Yes I see what you mean.
I think it was a case of my brain knowing what it was thinking without realising it wasn't on the printed page.
The subject matter moved onto VE's and new P1's so I was grappling with that
as further information, and then began to realize how it related to my initial questions about fractals,
for which I would like to thank you gucci.
It has been a further and welcome insight.
Thank you.
If I may ask for your continued patience, I would like to re-iterate from
your post # 2373, and my question in post#2374
I knew this because the market changed pace on 16:35 bar and didn’t return to dominance yet. Look at the price bar and volume. Furthermore all of this transpired in an accelerated B2B container.and my questions...
Would I be correct to say that the green rtl on your dax chart is your accelerated ?If so then you wouldn't have accelerated that until the close of the 16:35?
If so I'm a bit confused by that last sentence above I've put in in bold?
16:35 on your Dax clip closes above it's open and outside the range of the previous red bar, but you still considered it as a non dom bar. I shall have to ponder on why.I'm hoping the reason is definitive ?
My continued thanks gucci...
-
Why MIGHT?
Because not all of VE’s create a new sequence. Some of them are just the remnants of a previous sequence waiting for its completion. So in the example I suggested to work at, the market startet a new sequence at 13:35, but did not do so at 14:05. At 14:05 it just ACCELERATED the comletion of the sequence it started at 13:35. And why? Because it could not complete its 2B before it did its VE of this new sequence.
HTH.
Is it because we hadn't had a Brown P3 yet by 14:05?And the reason we hadn't had a Brown P3 by 14:05 is because all price action is still contained within the first Tape from Brown P1 to Brown P2 until 14:10?
In other words, we can't have a new P1 of anything until we've had a P3 of the previous thing we were building?
And we couldn't have had the P3 until we had a separate container (Tape here 14.10 to 14.20) from P2?
I'm hoping the above (in bold)both say the same thing all be it in a different way...what do you think ?
To add, I don't think the first Brown LTL is valid at 13.35.
Reason being that we would need a BO of the P1 to P2 Tape RTL to confirm we had a P2.
We don't get that until the 14:15 bar, hence the Brown number P2 at 14:10 and the Brown P3 there after at 14:20.
Imo we are only VE'ing the Magenta LTL.
Had the Brown LTL (the one from where the Brown number 2 is) VE'd then we would be looking for a new P1 after
the Brown number P3...?
Am I going mad ..lol ?
-
One more time... My answer won't give you any confidence. And that is what you need to be able to trade with support, comfort and confidence. Take your answer and apply it to the charts. This is where the confidence will come from. It should work anytime. Do not forget to think about the volume pane. It is still important. See what happens. You are on the right track.To have a P1 of anything we then need decreasing volume.
P1 to P2 has 2 halves of a leg, decreasing to increasing.
So I guess we don't have a P1 at 14'05 because 14.10 has increasing volume over 14.05.?
Trouble is I've lost the plot as to why repositioning or even having a new P1 is on the table, other than Spyders reply to Breakeven about a new Traverse P1 being in the wrong position on a chart Breakeven posted ...lol
-
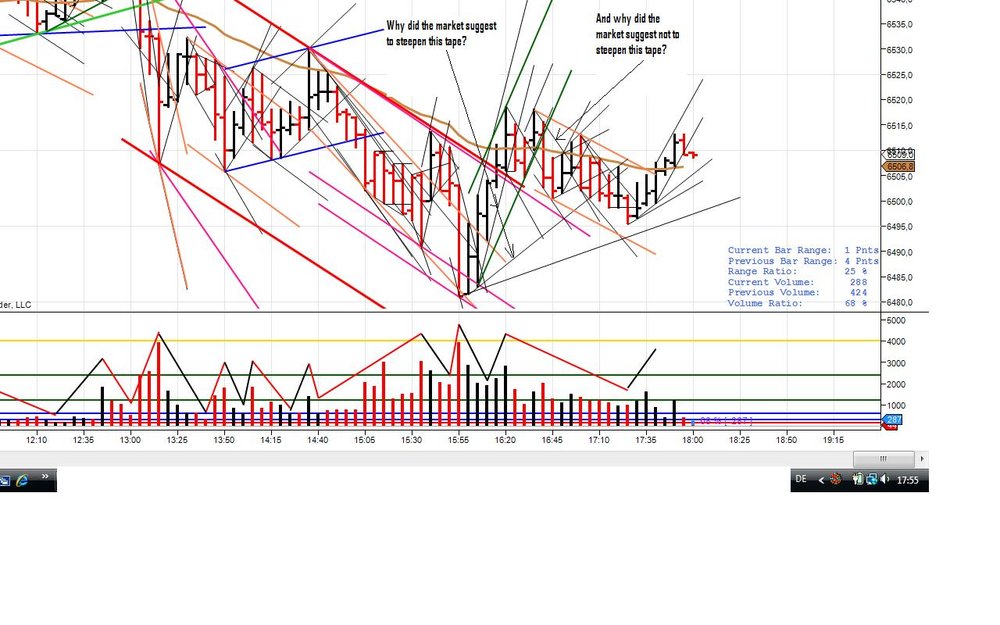
There is one VERY important question on the table here. WHY did the market suggest not to move a point 1 of an accelerated traverse (that started at 13:35) to 14:05?PAY ATTENTION to the annotated TAPES.
Sometimes the only thing one has to do to solve a problem is to ask the right questions.
Is it because we hadn't had a Brown P3 yet by 14:05?
And the reason we hadn't had a Brown P3 by 14:05 is because all price action is still contained within the first Tape from Brown P1 to Brown P2 until 14:10?
In other words, we can't have a new P1 of anything until we've had a P3 of the previous thing we were building?
And we couldn't have had the P3 until we had a separate container (Tape here 14.10 to 14.20) from P2?
-
......................................................
-
Thx EZZY..I've tried both typing in the
before and [/quote} after and tried highlighting the text and clicking that icon but neither does it beyond the first quote.No mind, I'' give it a try another time perhaps.
thx..
-
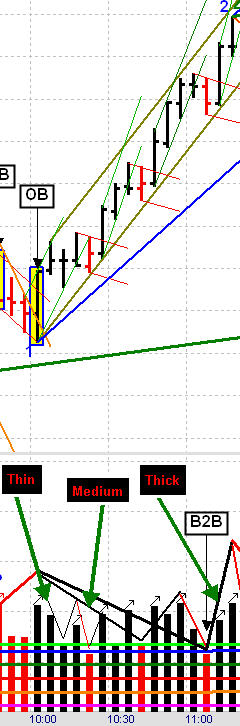
First of all, you should pay attention to the situations where volume suggests an acceleration of a trend and where it doesn’t. Look at the 10:40 (close of) bar. The volume is increasing, but is it really black? In the price pane you see that a lot of volume on this bar is actually red. So you can not have black volume dominance on this bar.Second of all, you can not place your medium 2R at 10:45 because the market didn’t break the container of B2B of the medium lines here.
Ok, I recall Spydertrader saying something like "orientate to higher highs and lower lows first and then close."
I think what you are saying is that a higher high here at 10:40 on Spyder clip does not make it an up bar, to which we would otherwise accelerate the rtl, because it closes below its open.
16:35 on your Dax clip closes above it's open and outside the range of the previous red bar, but you still considered it as a non dom bar. I shall have to ponder on why.
I'm hoping the reason is definitive ?
Third of all, why do you continue to ignore the volume behavior in the 10:50-11:00 area?HERE you see an ACCELERATION of the medium fractal trend and this accelerated container of B2B of the medium fractal trend is broken by 11:05-11:10 tape. This is your 2R of the medium fractal trend.
The market “jumped” the fractals here and you just had to go with it.
Yes I now see what you mean and to be frank I don't think I would ever have considered a bar with higher high on increasing volume as not being a return to dominance due to the close so my sincere thanks for your insight.
There is of coarse the situation where a bar making a higher high and closing either below it's open or within the range of the previous bar with increasing volume, would be a SOC bar and could only be so if it had also returned to dominance.
I suppose that will come down to what fractal the trader is trading and whether that SOC is on their fractal. (?)
HTHmost certainly and thx gucci
I knew this because the market changed pace on 16:35 bar and didn’t return to dominance yet. Look at the price bar and volume.Furthermore all of this transpired in an accelerated B2B container.
Would I be correct to say that the green rtl on your dax chart is your accelerated ?
If so then you wouldn't have accelerated that until the close of the 16:35?
If so I'm a bit confused by that last sentence above I've put in in bold?
You have to be very cautious here. The RTH for DAX end at 17:30, so you have to take that into account. Sometimes I continue annotating after hours for educational purposes only (just to learn the change of the behavior of the market ) but change the annotations the next day after restoring the RTH of the chart. Sorry if I added to the confusion. The main part was the annotations of the red down channel.HTH.
You have not added to the confusion.
On the contrary, you have made things clearer.
My sincere thanks for taking the time and effort to reply to my questions gucci.
PS: to anyone, how can I get multiply quotes included from a post?
there is only the one, as above and the rest have not been displayed in the same way
-
One more time… It is not ONLY about volume BUT ALSO about price.Think…
How do you draw a tape? Where do you place the point 3 of a tape? Since the tape is nothing more then the faster fractal traverse, think about the following questions.
How do you draw a traverse ? Where do you place point 3 of a traverse AND what HAS TO HAPPEN in the VOLUME pane for your point 3 of a traverse being in the right place?
Why do you HAVE sometimes to steepen your RTL?
Now what about the LOCATION of point 2? Does it have to be OUTSIDE of something?
Do not answer these questions for me. Think about them while analysing or annotating a chart.
Yes. AND where those troughs and peaks are located (see price pane, points 1,2,3 containers) AND what the volume did to price.
I can relate to your frustration, believe me. But the GENERAL principles where explicitly explained by Spyder in the beginning of this very thread. You just had to pay attention.
HTH.
I very much appreciate you patience and efforts gucci.
My issue is about knowing what fractal we are on.
I'm aware of the concept of this method where by faster things build the slower thing
that decreasing then increasing volume creates the gaussian V shape at X2X and we need increasing volume to confirm the P3 etc...
I know these things.
My issue is about knowing what fractal these things are happening on.
And I still have not found any resolution as to why the 2R leg is still inside the trend lines that contain the B2B leg on the spydertrader snippet.
I'm not laboring on the issue here regards each leg needing to have it's own container
and how are we to know what fractal level (medium, thin, dashed, dotted etc..)we are on.
Regarding containers:
IE: an X2X's (of a B2B2R2B) is within its own container of thin black lines.
Moving forward the 2Y (the 2R) is in it's own container and the final 2X (2B) is it's own container.
This is what I understood to be a principle of this methodology.
So you can understand why I don't understand why the 2R leg is not in it's own container on the Spydertrader snippet.
And it needs to be in order to have the 3 (B2B2R2B) thin gaussian legs to make the medium B2B.
I thought it was because we accelerated the Olive RTL (even though no LTL VE) because of increasing volume.
If this is the case then why, having accelerated the RTL at 10:40, didn't have medium 2R at 10:45?
Regarding knowing what fractal we are on:
I can better explain this with your Dax charts.
And thanks, I do see why you do and do not accelerate the RTL.
The Blue Up Traverse:
Your b2b (13:50-14:05) is within it's container (thin black lines)
Your 2r (14:05-14:25) is in it's own down container (thin black lines)
And your last 2b (14:25 -14:35) is in it's own container (thin black lines)
These 3 containers build the Blue Travers.
And indeed both your down Magenta traverses are built similarly with 3 things.
However, referring to your B2B 15:55- 16:20.
This is in it's own container of thin black lines.
but you do not annotate the 2R for the down container in the thin black lines from 16:20 to 16:30.
Nor a subsequent 2B in the up container of thin black lines from 16:30 to 16:35
Those 3 things do not build a travers for you even though there is a volume sequence.
I do not understand why they do not build a travers here
where as they do for the Blue Travers.
I'm trying to understand how you know those 3 things from 15:55 do not build a travers by 16:35?
This is what I mean by knowing what fractal we are on.
You knew to extend you B2B2R2B from 15:55 to to 18:00 even though there had been a B2B2R2B volume cycle by 16:35.
Thank you again and as per your reply, I have thought about this before posting.
I can't explain the multitude of ways I've looked at things over the years.
In spite of how much I do understand of the principles, I have always failed to know why, when using the same principles, they sometimes do not build the same thing.
Kind regards.

-
Yes exactly. Thank you.As per my post 2330:
is a B2B RTL BO on increasing volume required in order to have its same fractal 2R leg
a principle required for this methodology ?
Many Thx
No it's not an error that I'm quoting myself..lol
My question, I realize may have been miss leading.
I would say that yes a BO of the B2B RTL is required in order to have it's same fractal 2R leg.
What I am perhaps realizing is that the determination of that B2B RTL has more to do with volume than lines on a chart as we annotated them up to that point.
??
Regards to all...you too yoda
-
Something like this perhaps? Because we have no olive rtl bo, the thin gaussian continues, creating only a medium B2B, with the trough of the B2B where the black peaks start to increase.Yes exactly. Thank you.
As per my post 2330:
is a B2B RTL BO on increasing volume required in order to have its same fractal 2R leg
a principle required for this methodology ?
Many Thx
-
What about the following suggestion:"Try to think now about what the volume trough at 10:55 indicated. And what happened in the price pane and volume pane at 11:05 and 11:10"?
Thx for the reply.
I left out that part of your post for the following reason:
I was understanding a general principle to be that until the olive RTL had a BO on increasing volume then the B2B medium fractal would continue.
Such that we couldn't have the medium 2R yet.
I left out responding to volume peaks and troughs until this general principle was confirmed or other wise ? ?
What you are trying (most patiently and thank you) to convey, as I understand it,
is that the medium 2R is not defined as having to be outside the olive RTL,
but that volume determines where the medium 2R is ?
And even more specifically how that volume is formed ?
IE: higher peaks, lower troughs ets..??
Its not easy to talk this through in this medium so hope I'm explaining myself and thank everyone for their continued input.
For me, this is only about how to know to what fractal the gaussian relates.
If the solution, to understanding how to determine what fractal we are on, is about volume peaks and troughs then it would be great to have the general principles explained on that as I do not recall them being given in this thread, nor indeed in any of the threads that I have been following for at least the last 4 years !
many thx
-
Ok. Here is what I see in the chart. The question on the table is why the trough of the medium lines is not at 10:25.So see it this way. Let us assume you put your trough for medium lines initially at 10:25. So far so good.
What must come next?
Increasing black volume. At 10:30 you get it. So far so good again. On the price pane you connect the start of the sequence with the low of the price bar at 10:25 in order to get your container for the medium volume B2B sequence.
Now what must come next? Decreasing volume with price moving through RTL of the price container the market created with its B2B volume sequence.
What did come? Decreasing volume which failed to move the price through the RTL of the medium container.
So we can not be at the point 2 of the medium sequence yet.
What is the logical consequence ?
Try to think now about what the volume trough at 10:55 indicated. And what happened in the price pane and volume pane at 11:05 and 11:10.
HTH.
Do not forget: three movements for the price and four movements for the volume This is where overlapping of trends somewhere should happen.
Highlighted in bold, you say we cannot be at the end of the medium B2B, it's P2, until price BO of the B2B container (Olive) with increasing volume.
As price did not BO of it's B2B container (Olive), why is there a medium 2R gaussian ?
Why isn't that medium 2R a thin 2r gausian
ie: b2b2r2b 2r(at10.45)2b 2r(at11.10)2b ?
Or the thick B2B is not instead a medium B2B ?
Kind Regards
-
deleted..wrong answer...
-
Additionally:
"the beef is on a silver plate" was referring to patraders explanation on gucci's questions.
It is not without delight to have read that phrase, as I'm sure I'm not alone in saying., and sincere thanks to gucci for it.
I would, however, be humbly grateful for any feed back from patrader, or anyone as an ongoing process of civil discussion, if you could explain if your "explanation" had anything to do with the "repositioning" of the B2B "container" and how that occurred if it was the case ?
kind regards to all...
-
Undoubtedly true, but the problem lies in knowing what defines the point at which one knows this, what it is NOT constructing, and what the "other thing" actually is, and on what fractal. The general principles given at the beginning of this thread fail to make this clear.I concur here and it is at the heart of the matter for me too.
The reason I responded to the Spydertrader snippet was to establish how to know what fractal we are on.
IE: if the medium B2B relates to the Olive trend lines, then as I (and I assume savarez) contend that the medium 2R needs to be outside the Olive RTL, so would be what we are expecting.
This would I think relate to your reference to the "general principles".
We may have established that an accelerated RTL, because of aVE, would "reposition" the B2B RTL:
"containers" as gucci has referred.
I was, and remain unsure how, if it was the case, that that was done on the snippet, because of where or how the P2 was positioned.
If we recall, the P2 position would be important as it establishes when and if we have a VE.
In other words, if the Olive LTL did NOT VE, then we did NOT have the medium 2R yet.
So, as you say:
but the problem lies in knowing what defines the point at which one knows this, what it is NOT constructing, and what the "other thing" actually is, and on what fractal.I would have been waiting for the medium 2R and others had viewed that the medium B2B2R2B had completed, hence the Blue P2.
Going forward from Blue P2 may still have kept us on "the right side" but only up to a point, at which, we realized we were not on the right side of what we thought we were.
This, it may be argued is still "ok" and part of the process of "what we now know we don't have" and can be largely forgiving, depending on the size of the containers etc..
But the issue, for me, remains.
Being I want to "know" what fractal I am trading rather than become aware that the fractal I thought I was trading isn't and that knowing it isn't doesn't tell me which fractal it is.
-
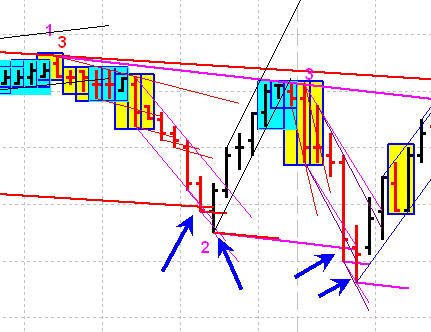
I am working under the belief that I should know the down container is not finished as soon as the first pair of blue arrows occur. So, by EOB blue arrow #2, I should know that the down container is continuing. If this is not the case please head me off so that I can stay on the reservation
Well, looking at only the two medium containers and focusing on the blue arrows I see two differences.
1. The first pair has a bar that VE and closes beyond the original LTL then has an IBGS that closes inside the original LTL.
2. The second pair does not have an IBGS and while bar 2 of this pair does close beyond the original LTL it does not close beyond the previous VE LTL.
Now, it seems like I am focused on where these bars close and to be honest I do not like that. If I were to rely on just where a bar closes, what happens when some numbnut hits the ask and suddenly the close is one tick from where I would say "Yep, it closed beyond"?
The same goes for the VE happening on an IBGS. What happens when by virtue of an arbitrary 5 min bar this IBGS happens to get split into two bars?
Please don't think I am trying to be argumentative here. These are just the questions I am asking myself when I look for a "reason" that something happens. I try to think of reasons that would still be valid if I shifted the timestamps of the bars by 1min or whatever. Which tells me where a bar closes in relation to its open or in relation to another bars open/close is not nearly as important as what the bar actually does.
Well, I know that not all VE's cause or create an accelerated container else the Pink container in this chart would accelerate. So, there must be a difference in these two examples that will be valid for all VE's that cause an accelerated container.(?)
Perhaps, to throw it into the mix for suggestion, as I'm not sure:
First 2 blue arrows:
No accel of tape rtl to bar with increasing vol (2nd blue arrow) because bar closes higher than previous close or because its an IBGS.
No FTT. (of tape ltl)
So annotate new (magenta) P2 (on BO of tape rtl.)
WMCN = completion of vol sequence from Magenta P1,
R2R2B2R.
Second 2 Blue arrows:
No accel of tape rtl to bar with decreasing vol.(4th blue arrow)
Yes FTT. (of tape ltl)
Magenta R2R2B2R vol sequence complete
= new P1 confirmed with decreasing black vol to tape rtl,
and increasing black vol on BO of tape rtl
= thin gaussian until BO of Magenta RTL.
??
-
You might wish to expand on this point somewhat. Note the chart snippet I posted and the blue arrows.- Spydertrader
expand on a volatility expansion..and there I was hoping for a gaussian fractal solution.
No mind, perhaps they are connected.
I think it's to do with:
1.whether the VE allows an RTL to be accelerated, (a new RTL in other words) as per your Magenta and thus a new Ltl.
a. by allow, I mean do we accelerate the (tape) RTL to a bar with increasing vol?
b. and if to increasing volume does the close of that bar need to be anywhere spcific to the close of the previous bar ?
an IBGS etc..
2. and when or which or if a new Ltl has been FTT'd.
3. and if FTT'd, then we have a new P1 for a new trend and the new trends P2 needs to be outside the last accelerated RTL (magenta) for the guassian B2B (if new trend is up) to be on the same fractal as the last 2R of the previous trend...
Just some thoughts, so no "f" typos please if I'm wrong.
I'm really quite sensitive
Ps: your charts are so rare these days Spydertrader that I'm getting a quote on ebay later.
I'll put the proceeds into the STC retirees fund, there are quite a few of us now lol
-
You've suggested the annotations were not corect. I told you the patrader's explanation offered you the beef on the silver plate. You think you do not have the data. All of the charts we are talking about are available. I've posted references to them. How much more data do you need?.And my understanding about the Gaussians... you know the market is still open.
Reading over your questions and patraders answers...here for convenience.....
1. Why does the sequence for the thin lines (thing, goat, tape, whatever) end at
10:30 ?
2. Why is the trough for B2B for the medium lines located at 10:45 and not at 10:35 ?
3. Why is the trough for B2B for the thick lines located at 11:10 and not at 10:55 ?
4. Why did Spyder tell ehorn he should be able to see three levels of Gaussians here ?(use the chart of Spyder of the previous day)
5. Why did the market form something on the price panel at those B2Bs ?
6. Why did Spyder put this blue point 2 at the the end of the last (thick) B2B ?
#1. Order of events completed on thin line fractal(fastest fractal shown with lines)
#2.The trough(10:45) location is the first decreasing red(non-dominant) bar after thin line fractal order of events completion and is immediately followed by an increasing black (dominant) volume bar.
The 10:35 bar is decreasing black volume bar but price is still contained in the taped two bar formation therefore still dominant.
#3.Same reasons for trough location as was given to question 2 but for nesting one slower fractal.
The 10:55 bar is increasing black volume bar plus price is contained in the taped two bar formation therefore it's still dominant .
#4.The orders of events was stretched out with no non-dominant order of events(faster fractal)?
#5. Because of the non-dominant volume bar which broke out of the taped two bar formation
#6.Because there was no non-dominant order of events completed during the last dominant order of events(faster fractal).
the difference of opinion, it seems, is how can you, gucci, be correct if indeed the medium 2R leg (container) needs to be outside its B2B leg (container), being the Olive RTL.?
I'm not saying your wrong btw.
I don't know who is wrong or right.
I am most certainly grateful for your efforts to explain how to understand why/how/where guassians are to be annotated.
I have thrown into the discussion, why, from the 10.05 bar, do we have thin g's to start with?
The suggestion, as I see it (and yes I maybe wrong etc..etc..) is that the trough of a B2B (ie: 10.45 and 11.10) being on a bar that closes outside of a faster (thinner) fractal rtl, designates that trough to a slower (thicker) fractal?
Even though the bars that those troughs appear on are still within the Olive RTL?
As I still don't understand why we annotated thin g's to start with I fail to see how to know in real time which fractal the gaussian is to be annotated on from the P1 at 10.05?
15_10_2010.jpg.0e4237779b841fa0891d6c3dd341d33a.jpg)
15_10_2010.jpg.67d4b63c8392b8b36929ac8ce346ff2d.jpg)


The Price / Volume Relationship
in Technical Analysis
Posted · Edited by zt379
It's that fractal thing again ...