Jump to content

Welcome to the new Traders Laboratory! Please bear with us as we finish the migration over the next few days. If you find any issues, want to leave feedback, get in touch with us, or offer suggestions please post to the Support forum here.

kalalex

Members
  • Content Count

    2
  • Joined

  • Last visited

Posts posted by kalalex


  1. One thing I've found in the many years of using these charts is that real time data and historic data are different. This is why I've always stated that the key to trading is learning to read a chart and that begins with a chart constructed with Constant volume bars. You've done that . . . well done!


    Now the indicator. Whatever indicator you use it shouldn't be confined to a range. The Sto and MACD are range bound and that is why they are worthless. Most other indicators are just as worthless for the same reasons. This is why I use the Ergodic. It is not because it is range bound not because it has some magical power.


    Now that I've set the ground rules and explained what I learned digging through and watching over 40,000 hours of real time data, I can tell you the key. Take ANY indicator that isn't range bound, apply it to the chart, adjust it to show you the extreme oscillations and make it smooth to ease you into being comfortable with making decisions on what is shown on the chart. Then watch that chart to establish your confidence in making decision based on those oscillations.


    The chart you posted is as good as any and if you learn to read it you will be consistently profitable. If you want to play with the parameters in your off hours to see if you can improve on them . . . go for it. That is a good way to learn the indicator.


    Since posting that thread on that other website, I've tweaked the parameters and improved on them. I've even had a programmer create a program that will read the chart in real time. It will label the entries, exits, reverses, stops and exits in real time. It will display trade alerts on the screen and send trade and exit alerts to my email.


    A new day is dawning.


    It looks like you've come far since the thread in 2009.

    Also it's seems that you advanced from trading just pullbacks after HH or LL (that's the basic concept I took from the other thread about your system).


    If you think I should stick with the indicator I have and be proficient with it

    could you post an ES chart, preferably 2401 volume, so I can at least have a chart to base off for comarison.

    I know you said it can by ANY non range-bound indicator but it's a CONFIDENCE thing from knowing mine's close enough to yours.


  2. Hi Logic,


    I just finished reading THE thread from ET and finally got some basic idea.


    Before I could ask some questions with specific setups I wonder if you could do me a favor.


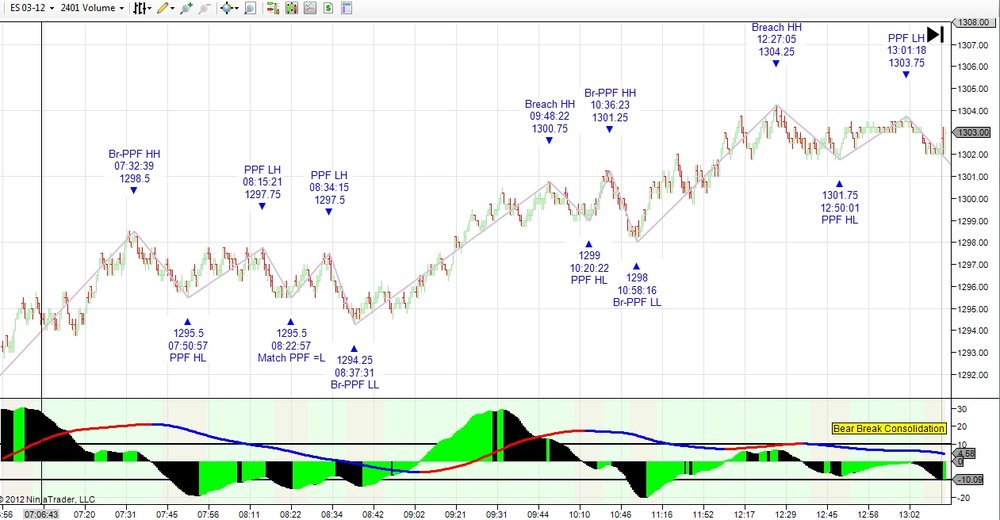
    I took the indicator from the other site and wonder if this looks right compared to your chart especially histogram part?


    I don't have old data and couldn't compare my chart vs yours that you posted here.


    If this doesn't look right or if you have updated version could you please share it?


    This chart is from 1-18-12 and time's pacific time. It's 2401 volume.


    Thank you.

    PFLOGIC.thumb.jpg.b07da451529a9ecfcfe4cdbbe52b167f.jpg

×
×
  • Create New...

Important Information

By using this site, you agree to our Terms of Use.