
Welcome to the new Traders Laboratory! Please bear with us as we finish the migration over the next few days. If you find any issues, want to leave feedback, get in touch with us, or offer suggestions please post to the Support forum here.


gozila
-
Content Count
30 -
Joined
-
Last visited
Posts posted by gozila
-
-
Hi DbPhoenix
how to identify the change of trend from wyckoff view point ?
See Section 15 of the course.
-
DbPhoenix, Why are you not using volume when you analysing chart,especially you are using wyckoff method??
Are you take in your account the trend on Daily chart when you trade on 1minute chart NQ or no matter
-
Mr.DbPhoenix
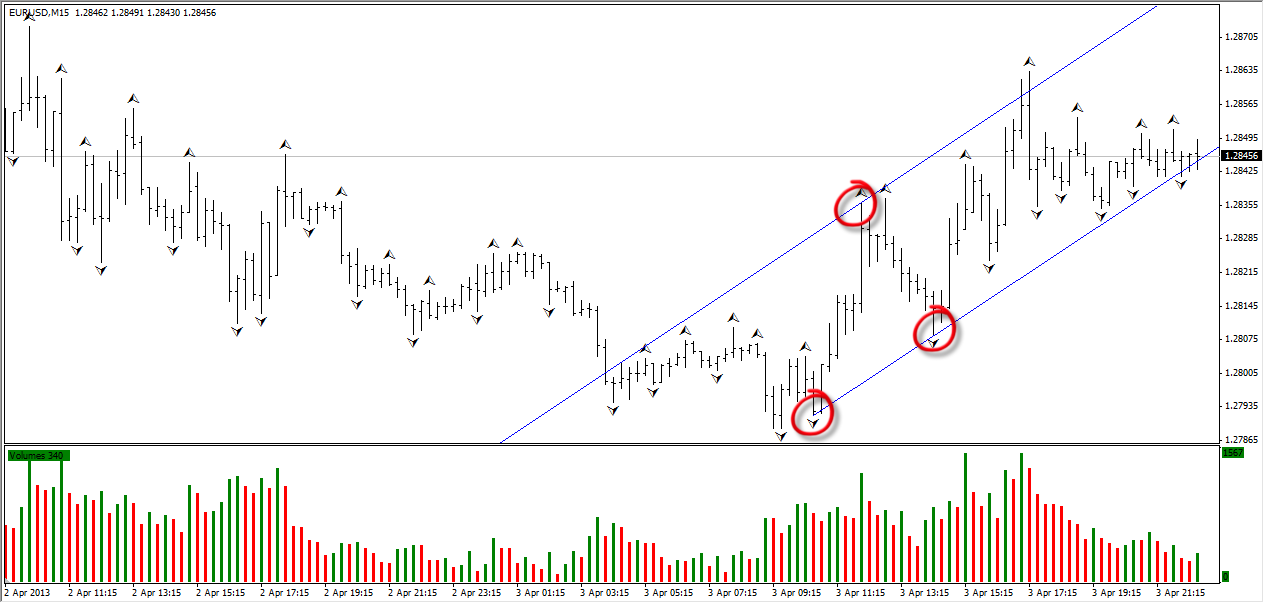
I identify springboard as you see in the chart by MP, is it true?
-
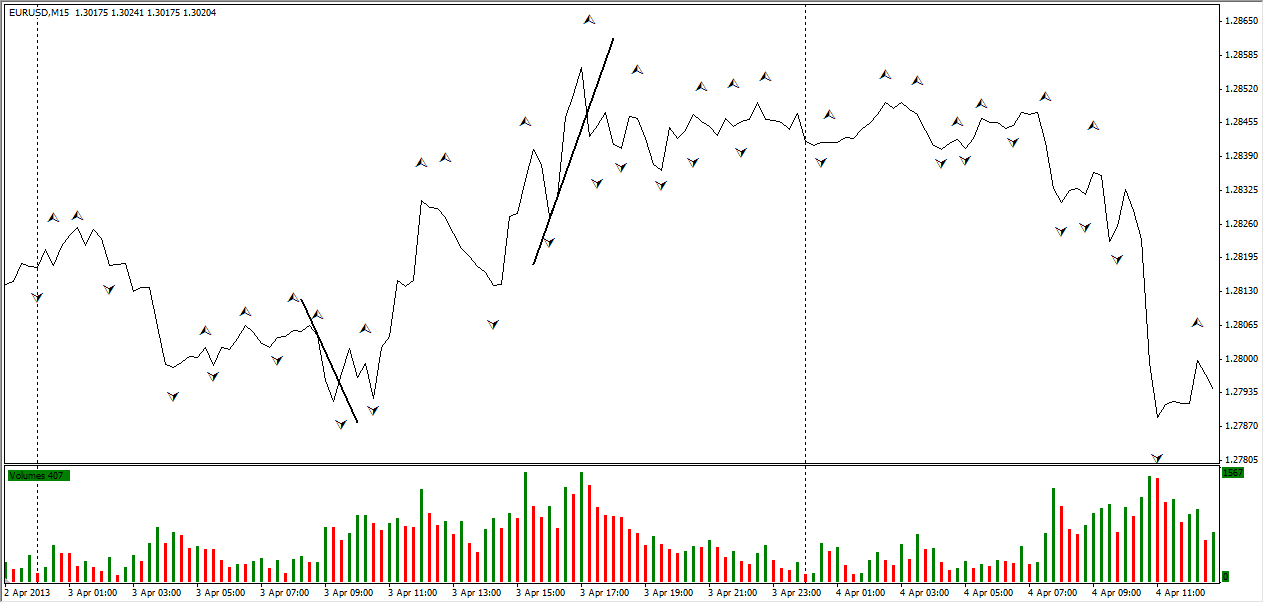
Dbphoenix please look at this chart

-
springboard is it indecision zones before explosion price (inside bars) and if not that how you define it on chart??
-
thank you DbPhoenix, your answer is clear,and i saw your chart...i have question on your chart
-
DbPhoenix,
I draw supply and demand line on bar chart and line chart,but the result are difference,i need your opinion


-
Don't know what you mean by "link". It's Section 15 of the course, p. 5. If you have not yet downloaded the course, see the Stickies.i am so sorry DbPhoenix, but all i have are
"Wyckoff method of trading and investing in stocks book"
and i am looking if there are any thread have more details or charts explaining supply and demand line
-
overbought and oversold line ( section 15 ) ????
give me a link to this section, please
-
DbPhoenix,
"supply and demand line"
do you think it is a clue to identify turning point,secondary reaction,the law of supply and demand?
-
Yes, except that your upper line starts where you have your circle. It does not extend to the left."except that your upper line starts where you have your circle. It does not extend to the left"
yes i understood, thank you
-
is it wyckoff channel as book said ???

-
Mr.Dbphoenix,
what is the best way to draw wyckoff channel without any human error ??
-
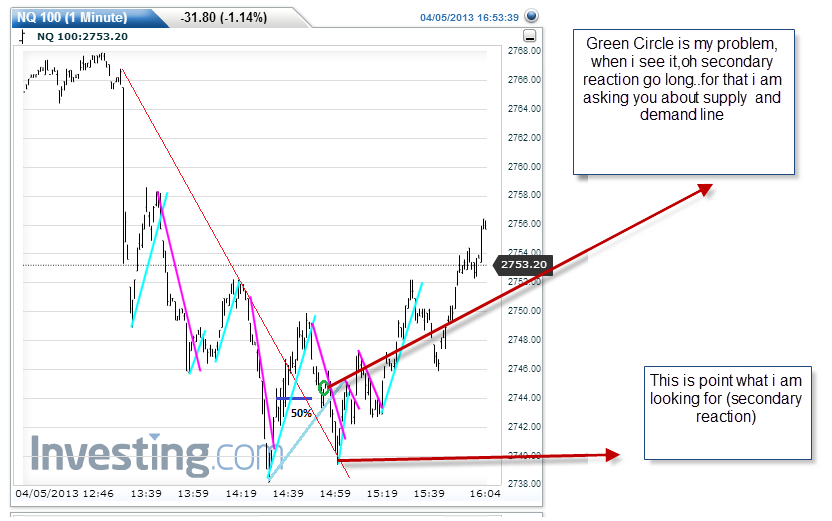
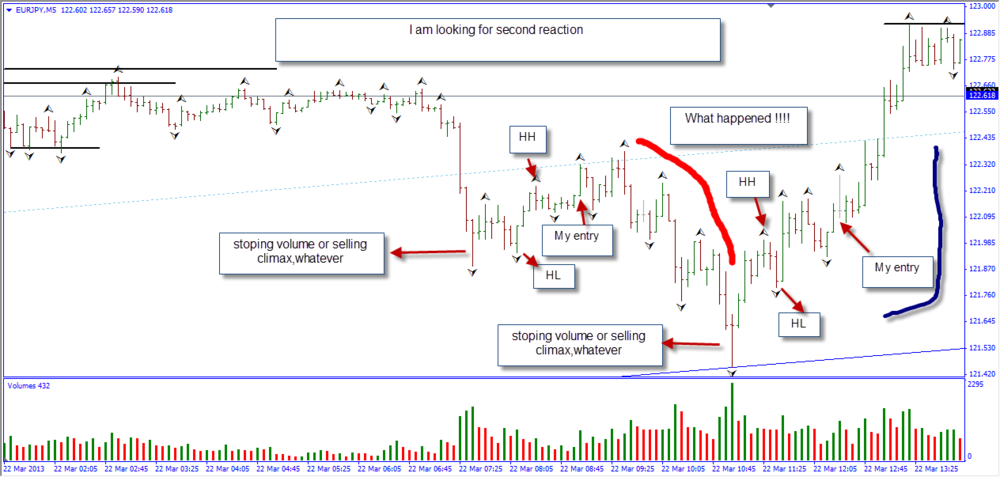
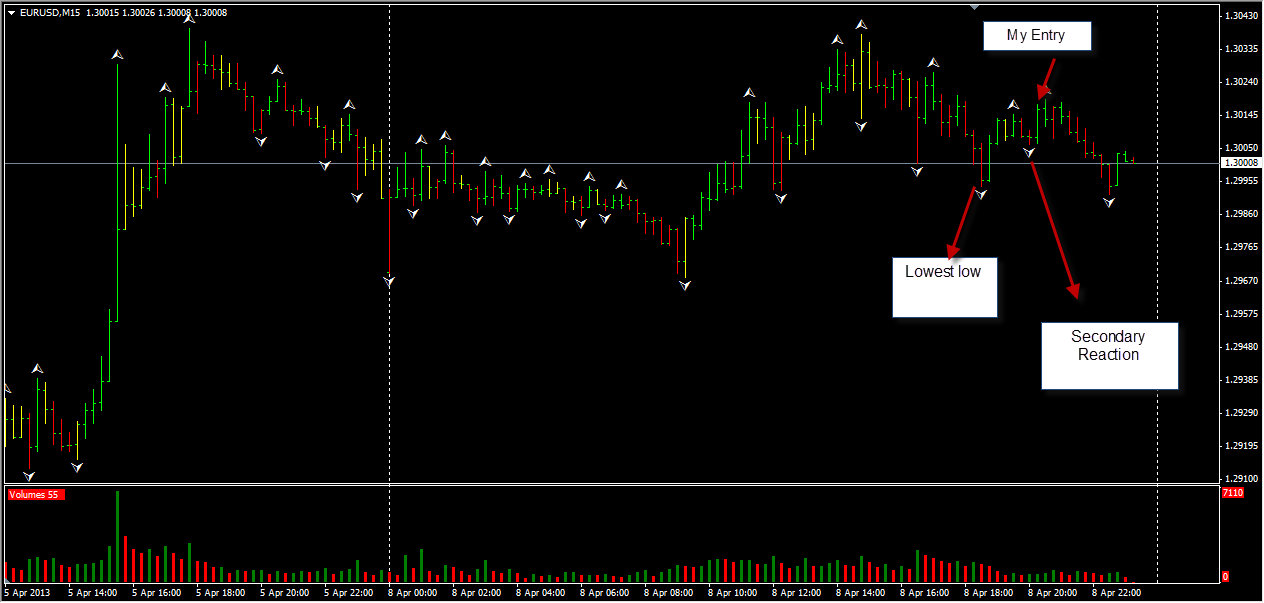
Thank you DbPhoenix i am trying to catch second reaction because i am thinking it is danger point which is the least risk
-
DbPhoenix any comment why first entry not work will or ( i mean why first second reaction not work will )
-
Yes, Wyckoff's course. Scan it using Ctrl+F "secondary reaction" (without the quotes).sorry Dbphoenix, i do what you said but ican not find it
-
position of secondary reaction is it ?? higher low + higher high or
Db phoenix.... if you have any materials or documents about secondary reaction for wyckoff pure method, please
-
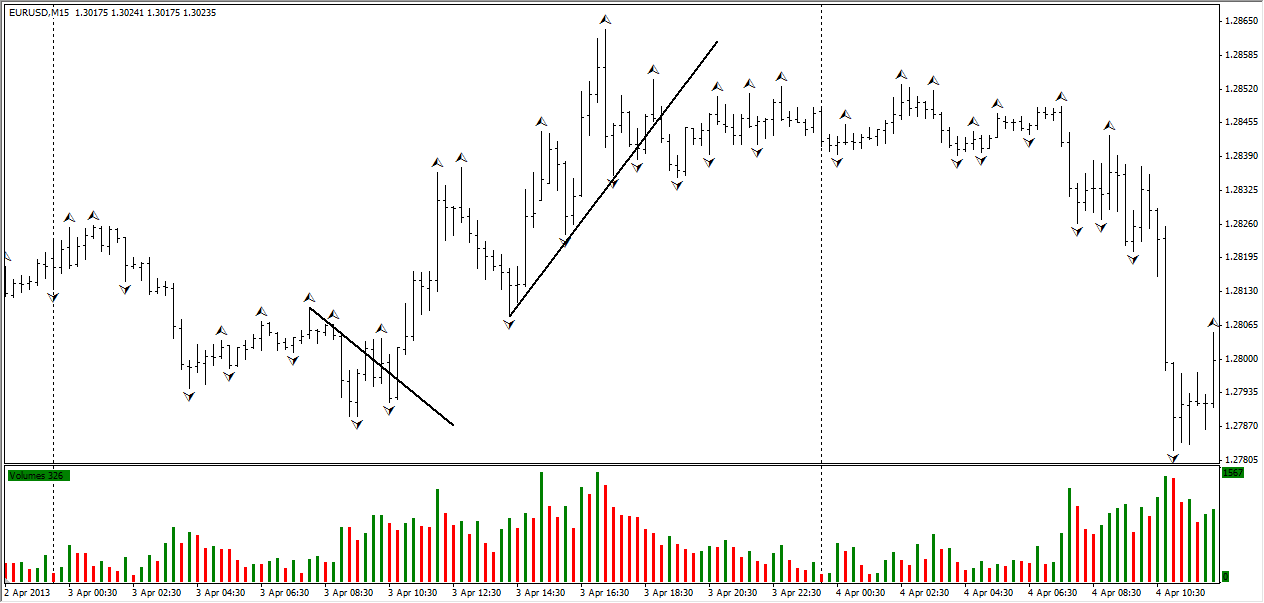
There is a term in structure called Shortening of the Thrust in wyckoff theory???
any body have information or materials talking about that
-
ice support is it higher low which made last higher high or is it higher low between lower high and higher high???
-
how i know the background ( Selling climax or buying climax ) is valid?
because sometimes after see Selling climax or buying climax the price continue in the same way
-
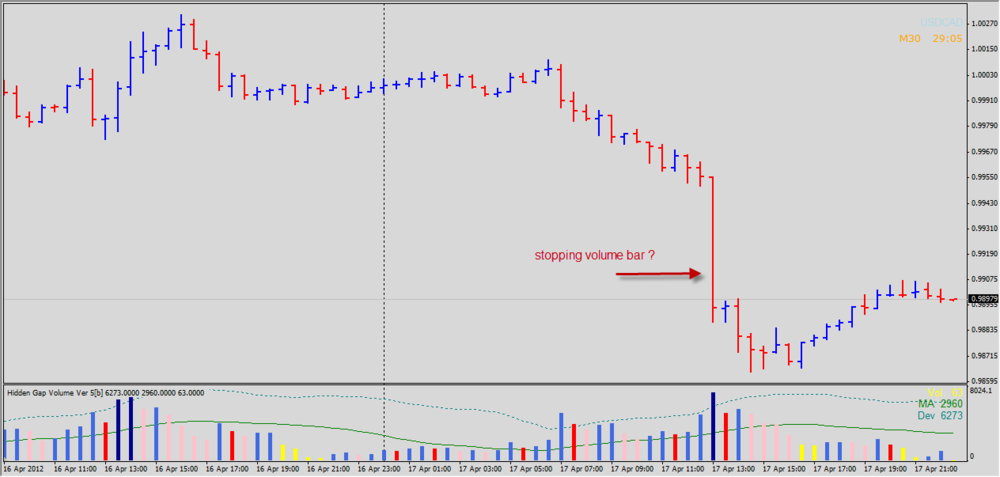
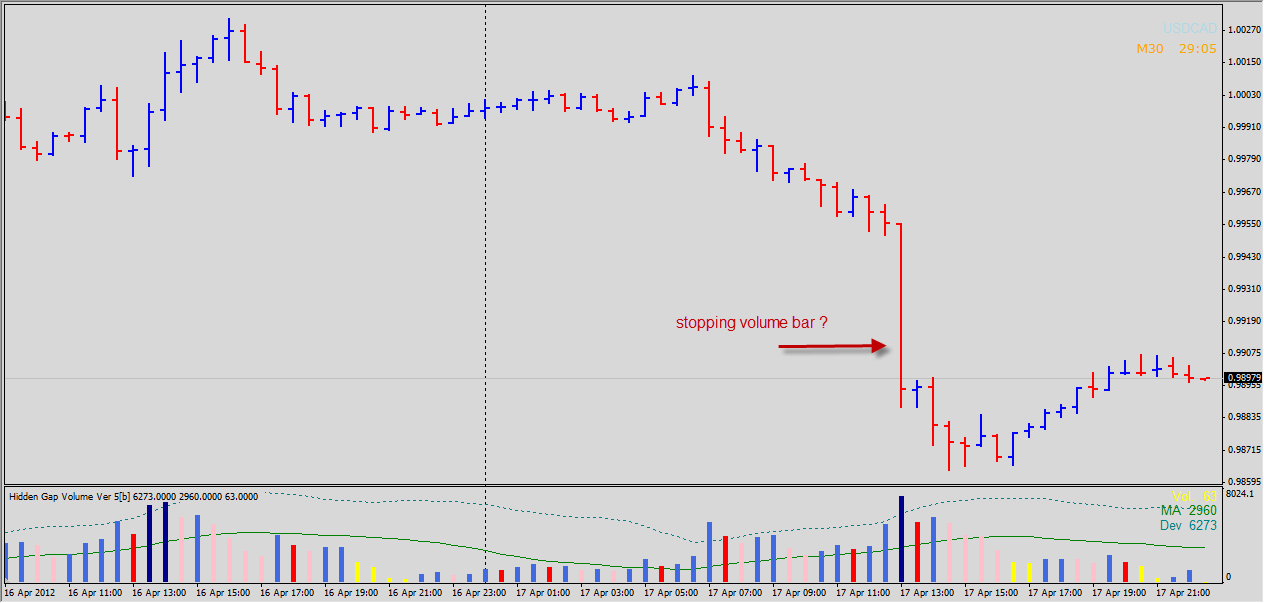
I have a confuse with this candle
is this a stopping volume and as you see next bar is up ( confirmation for stopping volume)
if i have stopping volume and also i have confirmation ( next bar is up ) ,but the trend continue down as in chart
can i take this candle ( stopping volume ) as sign of strength or forget it because the trend continue down?
-
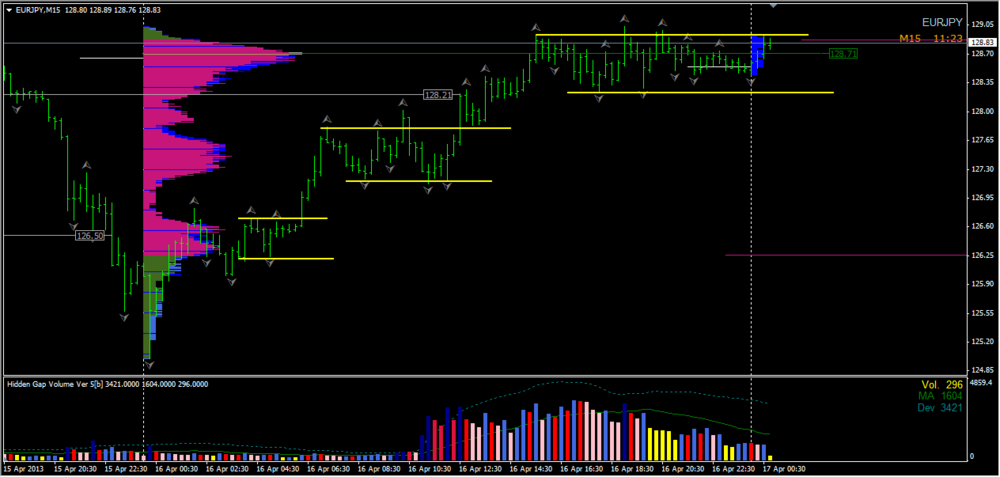
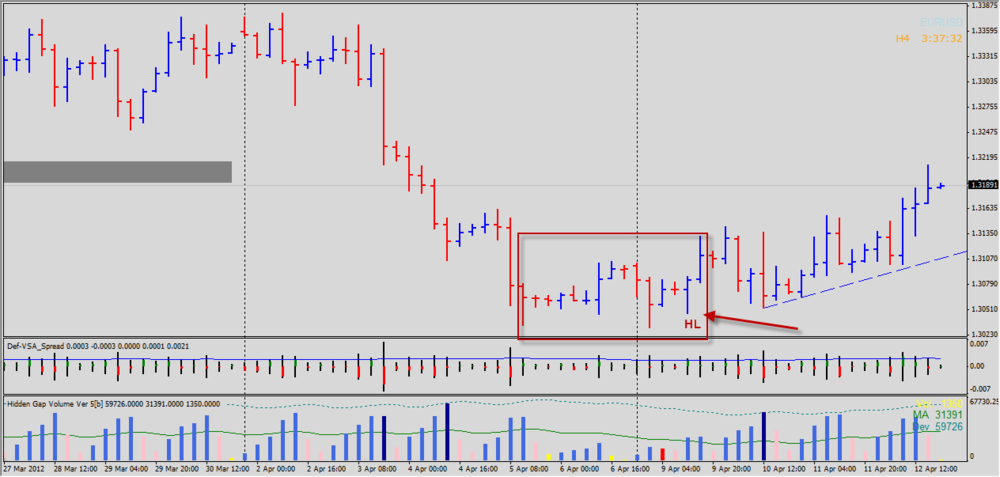
is this accumulation phase on 4 hour chart (eur-usd) ?
I thought this accumulation because as you see market make higher low & trading range inside box...and if not...why is it wrong ?
-
what is the best way to identify The wyckoff phases ?
-
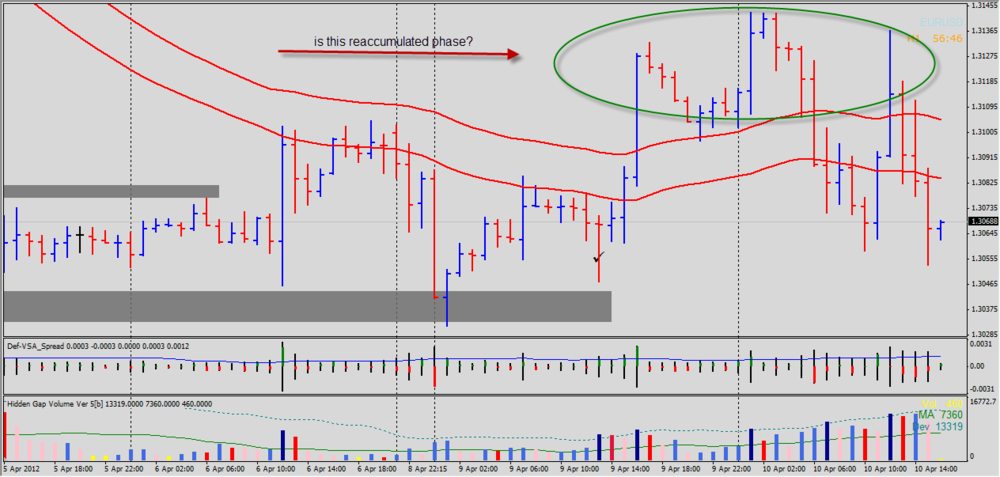
is this a accumulated phase?
anybody can tell me how does identify phases ( accumulation- distribution - re-accumulation - re-distribution)


Follow the Smart Money / COT Analysis
in Futures
Posted
Hi Dunstan, I am just curious how you analyze/consider COT for cross pairs like EUR/JPY?