
Welcome to the new Traders Laboratory! Please bear with us as we finish the migration over the next few days. If you find any issues, want to leave feedback, get in touch with us, or offer suggestions please post to the Support forum here.

Dinerotrader
-
Content Count
728 -
Joined
-
Last visited
Posts posted by Dinerotrader
-
-
Scale
in Open E Cry
After you put some sort of text on the chart, right click-properties. Bunch of options there. If you find the font and size you like, I'd save it as default.Thanks. I think I somehow didn't realize you could right click things and get specific properties for that item you clicked on. It makes sense with since everything in Windows does this but the other items that show up on the "right-click" box are not item specific so I got confused. This is the key I was missing. Thanks.
-
I struggle w/ the same thing Dinero - my p/l was alright today, but could have been more. Trailing stops is a fickle animal and here's why - days like today, you want to trail your stop liberally and make a killing. Other days, you will take +3 and +5 all day long.IMO you just have to decide what YOU are comfortable with. Your options:
1) Take reliable, predictable bunches of profits in increments. Make money most days.2) Go for the home run and make killings some days, breakevens on other days.There is no right answer - it's entirely up to what you want to accomplish. I take a #1 view even though I try my hardest to bring a little of #2 over when appropriate.
The more I look at Oil charts and contemplate your ideas above the more I think I really need a rule system to decide when I will trail my profit or when I will leave my stop alone to wait for the 150-300 tick move.
Today, I remember getting into 2 of the positions based on a longer term S/R consideration and I thought, this could be a huge move. Both ended up being huges but I have a habit right now of trailing so I didn't consider just letting it ride without trailing it. There are however many trades to be taken which are not based on such good S/R levels so those I would take what I can get and probably trail 10-15 ticks behind or at each natural stop point. If price is at a range extreme (from a larger scale chart) and looking to reverse, that seems like a point at which you don't trail and see if you can make that homerun. What is the worst that can happen, you take a ~breakeven trade.
Thales demonstrated this on a USDCAD trade recently in his thread and it made sense to me. You probably saw his post about this trade.
Of course even with a home run trade you have to decide when to pull the trigger and take your boat load of money out of the unrealized column.
-
Scale
in Open E Cry
Okay here is how my chart window looks now. Do you have any suggestions? Did you ever figure something out to change your chart appearance that was really useful that I haven't incorporated?
Question 3
I haven't been able to figure out how to change the text I write on the chart. I click on the text tool and I can't change the font or size of the text.
-
Scale
in Open E Cry
Thanks garak. I couldn't seem to get this figured out.
-
JB - if you like that, check out the CL oil contract.
Great, now you went and let the cat out of the bag to everyone.

-
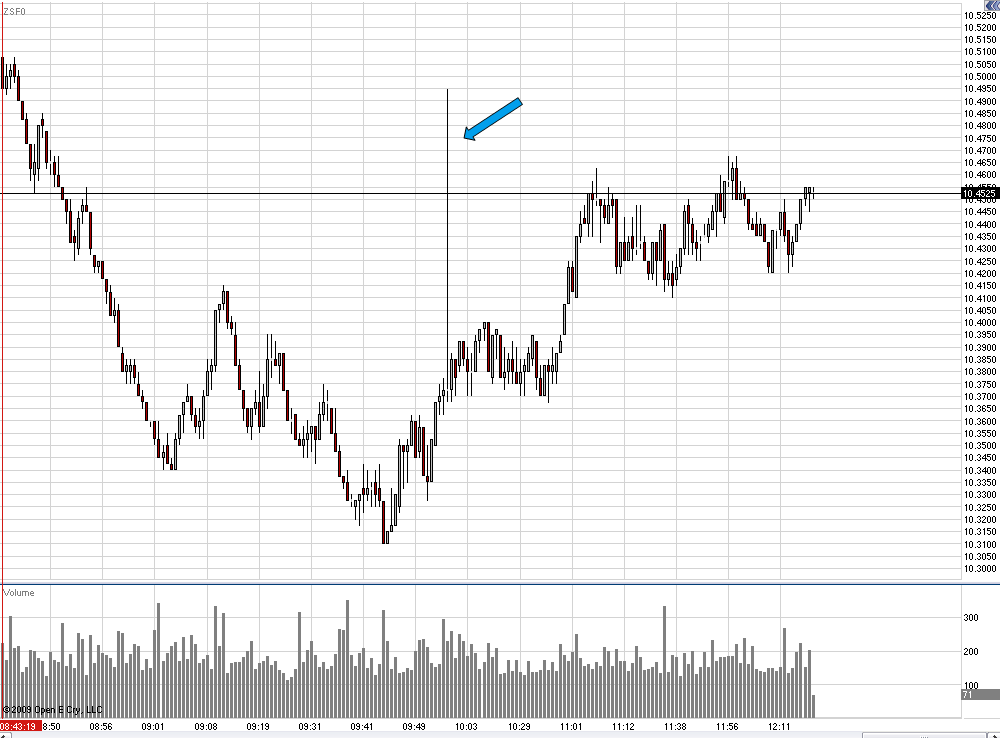
ZS
What was that spike! Is the chart correct?
-
Found a couple oil icons that I thought were funny. Feel free to use if you enjoy oil as much as Dinero & I! Think I might be needing to change my avator here... :rofl:I like the top one best.
I guess my current avatar could pass as something oil related. My avatar is actually my logo I designed for my photography business.
-
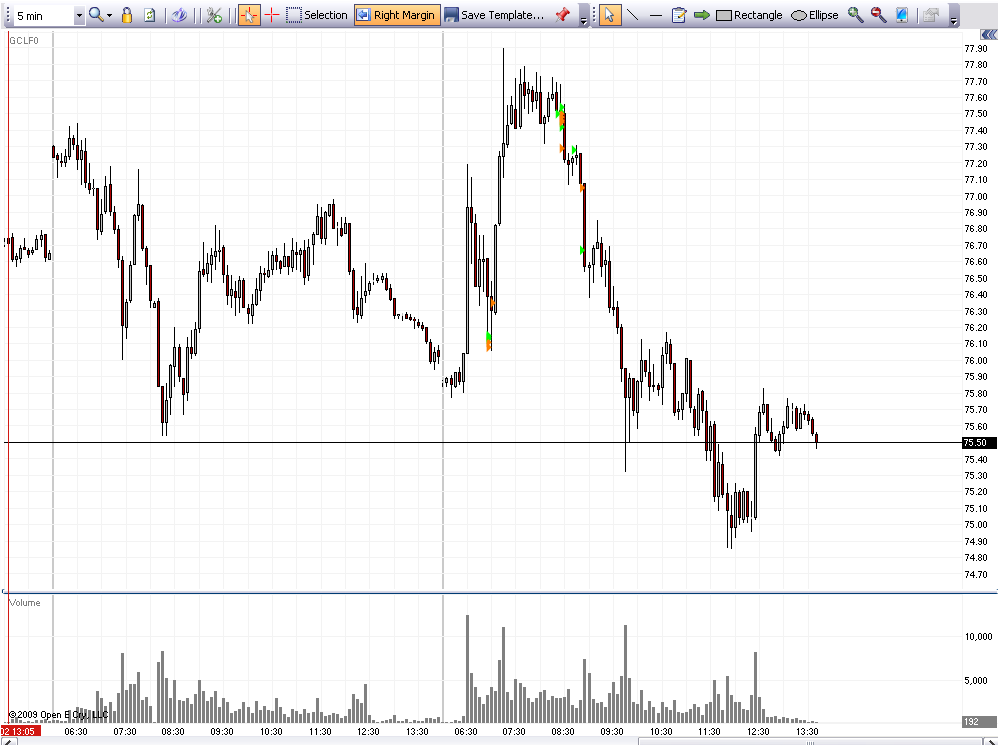
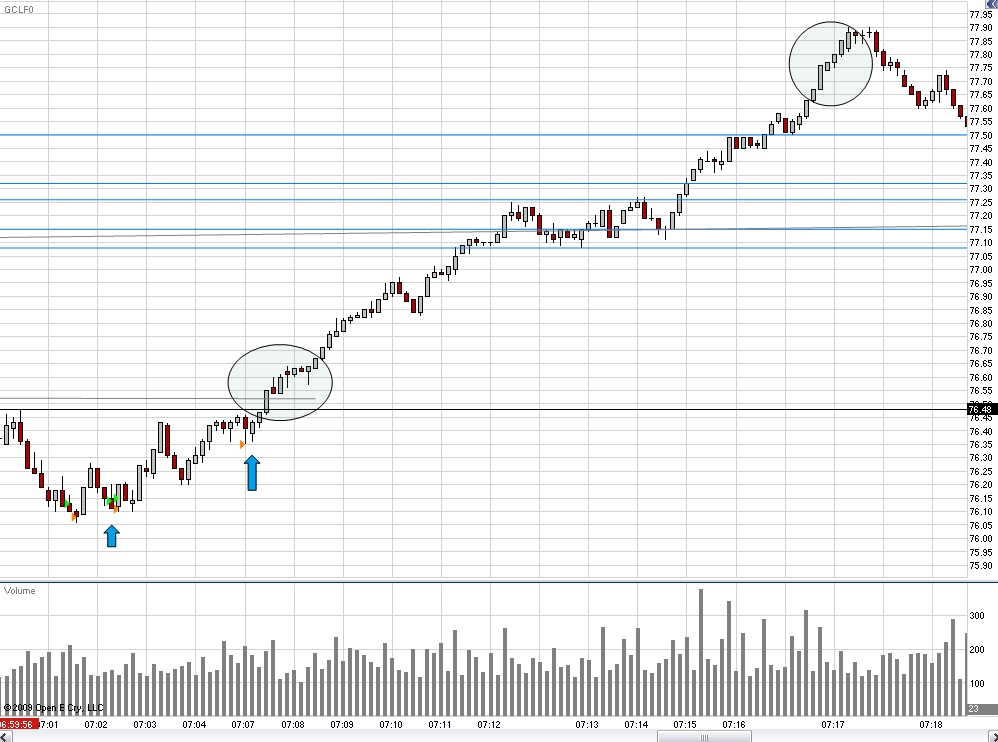
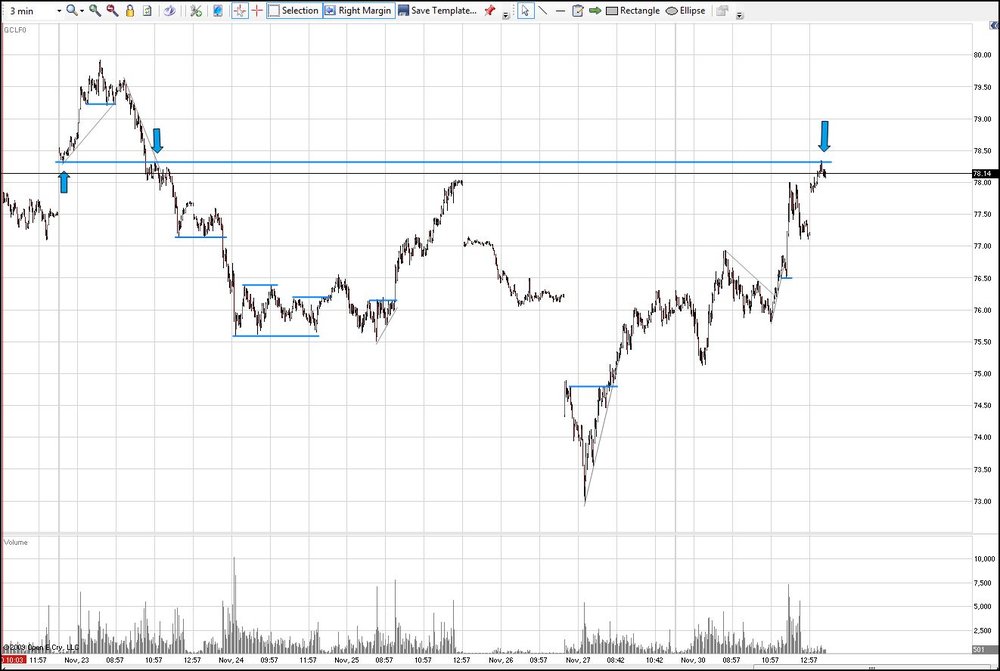
Holy Freaking Oil trades. Today was and probably will continue to be a great day to trade oil. I am really busy at work so I can't keep trading it. I should have had a record day but I am still struggling with trailing my stops too close on the big oil moves.
Check out how much of the move I missed on this one. I arrowed my entry and exit. All the move between the circles was lost for me. About 120 ticks lost on a trail that was 5 ticks too close. I did better later on and kept my stop at breakeven though I was up 20 ticks and got stopped out at breakeven. The 3rd move I was in, I thought a 15 tick trail would be reasonable and once again I got stopped out only to miss out on more of the move. I am still working on this.
I will be shocked if Brownsfan's P/L isn't amazing today. So far 3 oil moves, each giving a possible 100 ticks each. What a day. I couldn't even watch the ZS I was so focused on oil.
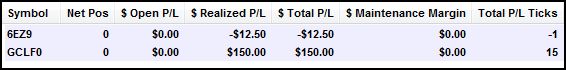
SIM
+$380

-
12-3-09 Revised (again): +$3017.49Alright, this was about as bizarre of a day for me as there has ever been. It started with my scratch performance in the AM. I wasn't too happy to see that occur. So then the pre-workout trade took place. Then I was at the computer and got a few more setups in the PM. I'm typically not even near my computer at that time, but it was there for the taking.
Trades were taken over 3 different computers, hence the 3 screenshots.
Feels weird that my best day since posting on this thread was my most bizarre one. Pretty sure this was the best p/l I've turned out for this thread.
You might need to start putting in longer days with those numbers. Nice work.
-
SIM
The day started alright. I was up $300 on Oil. There were 2 large oil moves today that I got a piece of but I was frustrated that I didn't get more since the retracement was manageable with trailing stop. The frustration motivated some more careless trades on Oil which shouldn't have happened. I tried the QM today and it just didn't feel the same as the CL contract. Not sure exactly why.
The ZS worked me. Once price got back into a channel it had established recently, and the whipping began. I should have help off on any trade once it moved to that range.
BF, it is interesting how some days the ZS seems easy to trade and some days oil seems easy. There could be numerous reasons for this but I was curious of your thoughts. Do you think you can anticipate to any degree if one or the other will be harder to trade based on where price is at?
The late oil short was certainly worth a try even late in the day. Wish I could have been watching it at that time.
-
Scale
in Open E Cry
Question 1
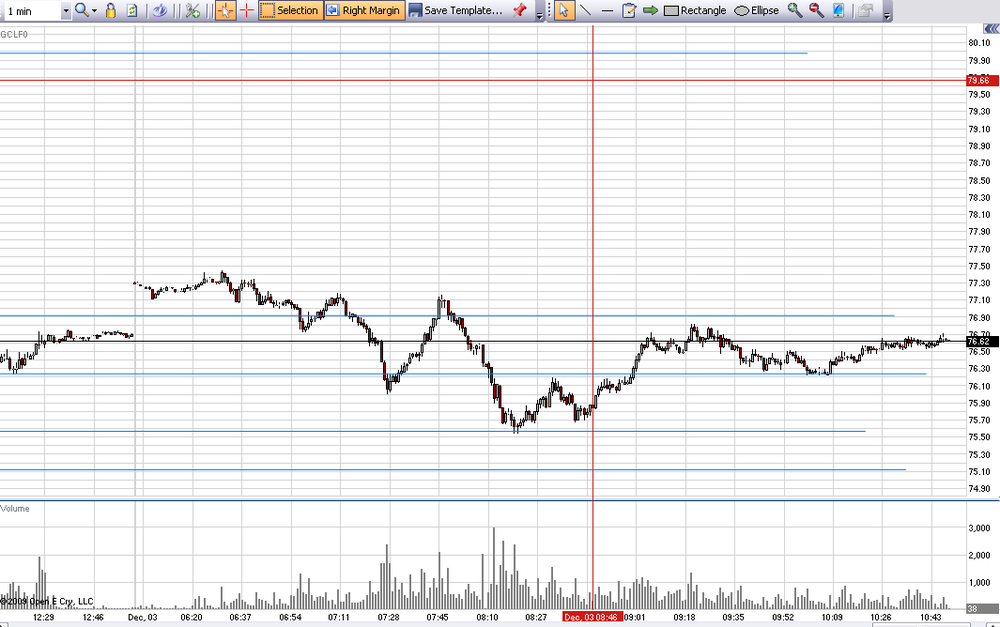
I am trying to mark S/R lines from prior days so I can have them noted on the current chart but my scale gets messed up so everything is tiny. How can I make the chart NOT try to fit all my S/R lines on the screen but still adjust to price as it moves?
Question 2
I haven't been able to figure out how to change the X axis and associated grid lines to show the time intervals I want. For example I would like to change the chart below to just show vertical grid lines at each 30 minutes and have those grid lines labled with the time.
-
This is what my quote window looks like:This way I can't miss when the new contract has volume. Also - if you roll ANY grain, then you probably need to roll all of them. Same with oil - if you roll the QM, odds are the CL needs rolled as well.
I hope to be back at it with you guys soon, nothing here as I am fighting some stomach bug thing.
Good idea. I will do the same on my trade screen to watch volumes. I think I am also going to try to set up some reminders.
I had the stomach thing over thanksgiving. Not fun.

-
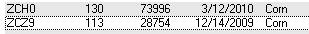
Careful with that December corn contract. Roll corn and wheat to march.Whew, that makes even a silent lurker shaky. I recently looked at roughly the last years historical grain trading and it seems that the volume seems to pick up on the next contract two trading days before the first calendar day of the current contract month. For some odd reason or another.
Thanks for the heads up. I don't trade corn very often. I need to set up some reminders for myself to go off when I need to start becoming aware of contract rolling.
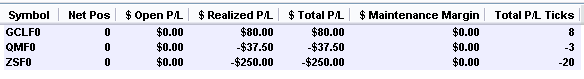
Here is the volume split today.
Littlefish, feel free to join this thread. BF and I are all alone on the grain trades. I am still just SIM trading.
-
Not a lot of time today to focus and trade. Oil just kept on faking me out until I finally got a hold of a reasonable move. Lots of software freezing up today. I caught most of the big down move (offset by some bad trades) on the ZS which I was expecting to happen (see grains thread) so nice call on that one Dinero. Oh, why thank you, it was a good anticipatory conjecture.
I must be tired.

-
It seems like there should be some good options through some type of collaboration of self employed people or small business assocations.
-
Dinero - I think it's a bit easier than you are thinking... Here's how I see what you did:1) Define S/R levels. Obviously this is key for this to work consistently.2) From there, look for trades - and I would suggest that you could have gone long OR short there. Why? If it's an active level that you are anticipating, it could also become a breakout area as well.3) What chart setting is your daytrade chart set to? I'm asking b/c as you pointed out, price got to your level and then had no interest of breaking it. But I'm wondering what chart setting that is.I think defining some rules around this could be something as define S/R then look to see what price does there - does it bust through like that level was not even there? If yes, consider just jumping on that train and go with it. If no, then consider a reversal trade as you illustrated here on today's charts.
My chart is currently set to 100 ticks.
I only noticed the R for this trade when price started stalling. I probably need to draw more S/R levels before hand so I am ready and mark them in some way so that I know how significant I expect them to be. This would have been a level I would have given low probability of becoming tradeable but when it started stalling I would have been ready. This is making more sense as I write this.
-
find a broker you trust that will spend the time to help you through the insurance process. Your broker will or should perform proper field underwriting to find the best fit once you both have a meeting of the minds. Good luck.Do you have any recommendations for finding a "broker you trust". My natural inclination is to not trust a broker and assume they are just trying to make some money off me. I used a broker many years ago when I was self employed and it worked out okay but I really had no idea if should trust them. I had to because I didn't know what else to do.
Price isn't my biggest issue. I just want something reasonable that covers the things you expect insurance to cover for a competitive price. I can earn enough to cover the monthly premium on a quick 20 second oil trade.
-
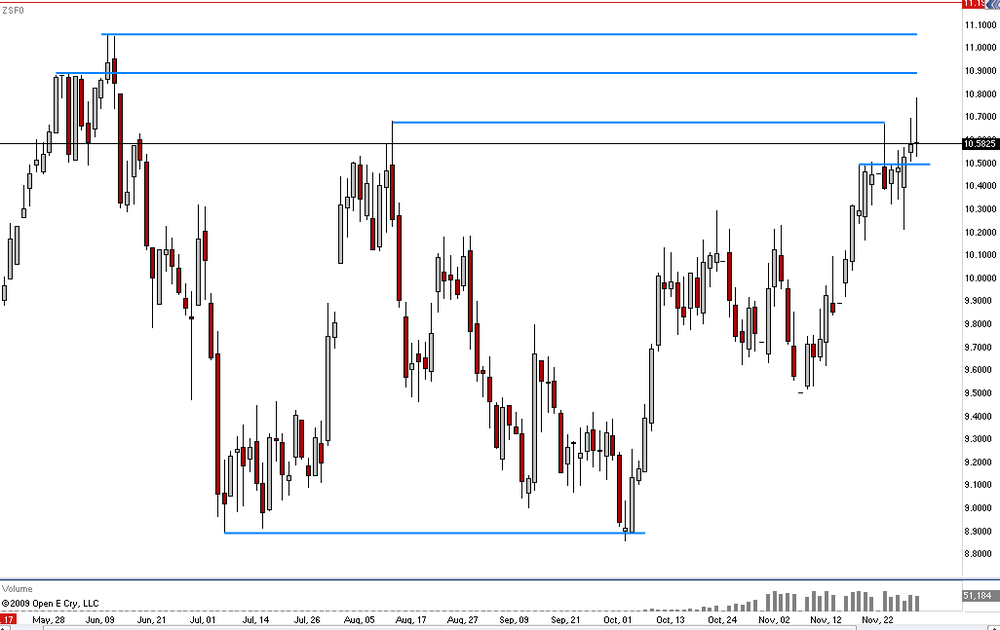
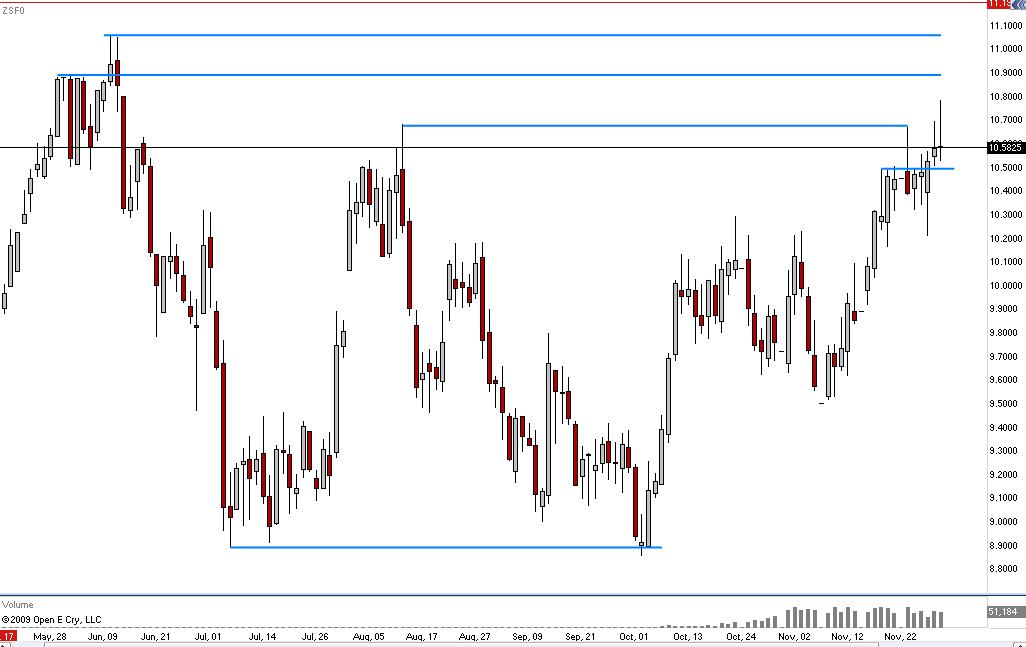
Here is where we stand on the ZS. A valiant effort to break higher today only to come right back before close. Just about the same thing happened yesterday except today the bulls had a little more gusto during the 1st hour of trading but they subsequently got beaten down the rest of the day. 2 tries at new highs and both tries failed.
I will be looking for a breakdown tomorrow especially since today's close was ended in a drop off.
I wish I could see a multi year chart of this so I could tell if seaonality affects the larger picture. If anyone has a larger scale chart, please share.
-
This morning I just got this virus on my computer and as I am finding out, many others I know that use ant-virus software have also gotten it. I have always taken measures to prevent viruses and have never gotten one until today. We are still trying to remove it. I am not exactly sure of the best prevention but make sure your anti-virus software is up to date and look into getting a program called MalwareBytes Anti-Malware to prevent getting it. The bare bones version of this program is free. The virus specifically prevents you from installing this software once you already have the virus. Most of the fixes for this virus involve using this software which is the only reason I mention it.
The virus is called Security Tool.
Do a search on google and you will find loads of people trying to deal with this virus. I wish one of my family members that dealt with it had told me so here is your warning to get prepared. It got right through my Mcafee anti-virus software.
-
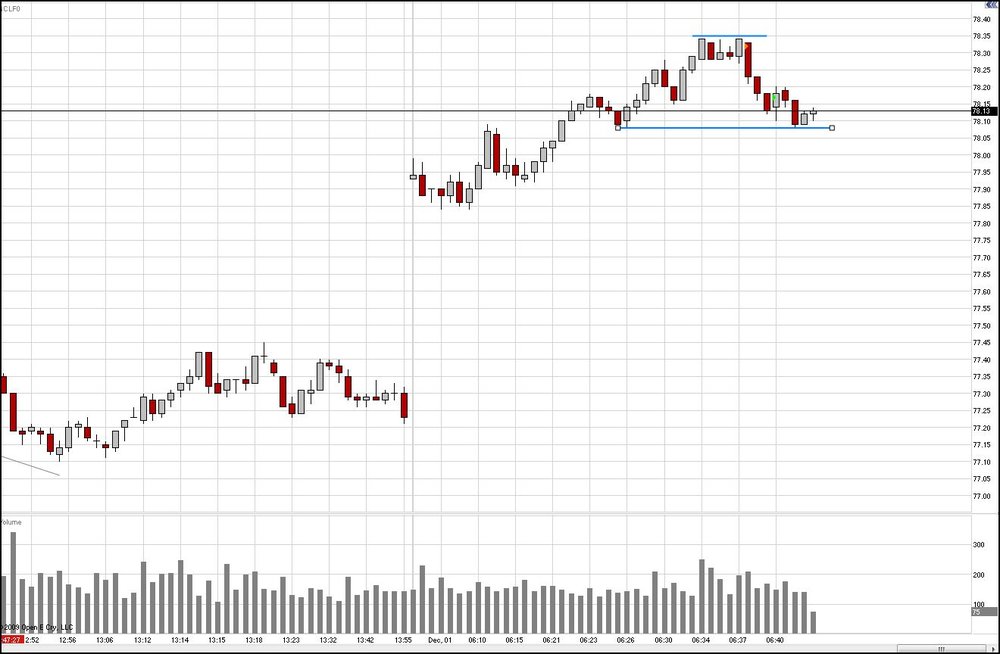
Here is a SIM trade I took this morning on Oil. There was some R at the top level back on the 23rd when Oil was there last. Stop was only 3 ticks back. I ended up getting 15 ticks on this, stop got a little too tight, otherwise I'd still be in it. Hopefully, you can see my entry and exit triangles on the 1st pic.
This is the type of trade I am having a hard time building rules around. It worked but I bet against the trend on a reversal because of the R and the 5 bars that got stuck in that area. Maybe this isn't a trade a should have taken because of the trend but maybe my risk was low enough that it was okay to take. How would you form some rules around this?
-
Right, Brownie. How could anyone possibly think they could trade with such a pathetically outfitted tool box?I'm pulling for you, Dinero, but I'm not a warm weather person. So if you get yourself hooked on indicator crack, someone else will have to fly out there for the intervention.
Best for you never to try the stuff. Trust me. It took me years to kick the habit. You are not missing anything. Trust me.
LOL. I bet you would really like the warm weather.
No intervention for me. I won't be going through the indicators.
I do trust you guys. That is why I hang around your threads and post my novice ideas so I can get set straight when I stray from the path to success.
-
All you have is:- S/R
- Trendlines
- Candles
- And price
You poor thing.
If you want to open that indicator pandora's box, do it already. In another thread I warned you what may happen but if that itch won't go away, then itch it. Just don't say you weren't forewarned.
And if you must do it, stick with the simple stuff that you can understand how it's even constructed. Moving averages are easy to grasp, volatility ranges (bollingers, keltners) or oscillators that show overbought/oversold areas.
Just be prepared to be massively let down. You will find what you think is the grail b/c one day bollingers nailed every single move and the next you'll get slaughtered.
I have one suggestion if you do this - post it here so others can learn from it. Seriously. Start your own 'indicator experimentation' thread and run w/ it.
Yea, I probably shouldn't have posted that last post. It came across the wrong way. I won't be using indicators because I do trust you and others that have helped me so much thus far.
I might use an indicator if it clearly showed me some of the things I look for in price movement but I have so much more research and trade analysis to do before I can start that search.
I'll try to keep posting some charts that look like reasonable setups based on the signals I noted above.
- S/R
-
I think you'll find dinero that the more confluence of reliable signals you get at once, the stronger the trade. The key finding the reliable ones.Reliable signals....
Since I have never looked at indicators, all I have in my arsenal to consider is S/R levels, trendlines, candles, and price action, if you can call that a signal. Maybe I should look into moving averages a little since so many traders are using them to decide on trades also.
-
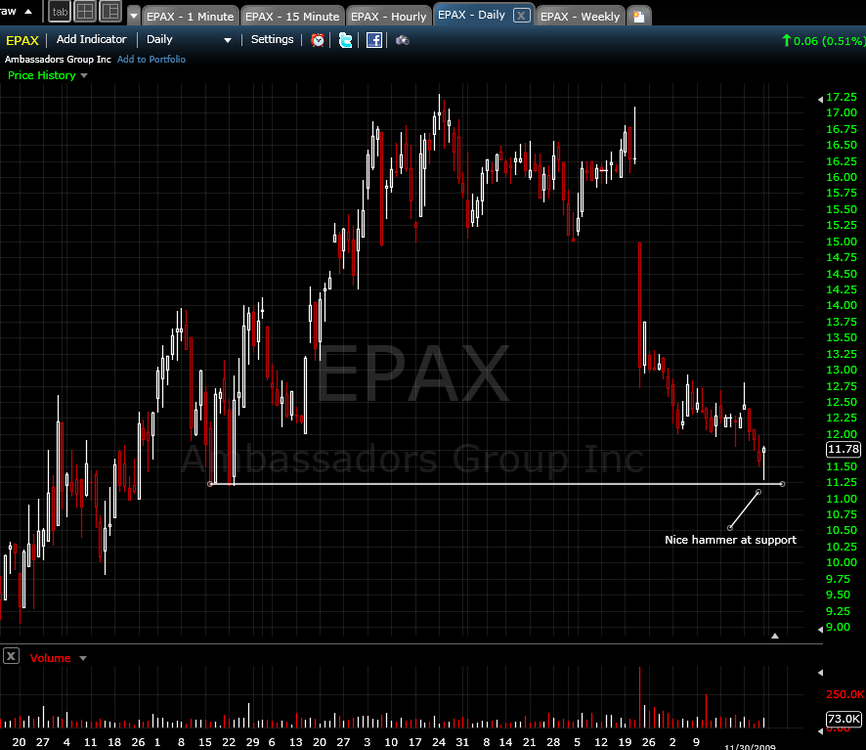
Got a nice hammer on this stock today right at a possible support level. We'll see if tomorrow brings "confirmation" PA to validate the reversal trend.


Scale
in Open E Cry
Posted
I agree with that. Just wanted to make sure there wasn't some hidden icon you can click on and it will show you where price will be 1 minute into the future. That would be helpful.
I don't know why I like the right margin. I always think I need more screen space but when I don't use it I feel like my mind doesn't have "room" to "see" where price is going. When I start using lots of quotes it normally means its an emotional thing.