
Welcome to the new Traders Laboratory! Please bear with us as we finish the migration over the next few days. If you find any issues, want to leave feedback, get in touch with us, or offer suggestions please post to the Support forum here.


RichardTodd
-
Content Count
90 -
Joined
-
Last visited
Posts posted by RichardTodd
-
-
If anyone knows how to stop Ninjatrader from autoscaling, please let me know here.Fixed scale is one of the many features coming in NT7... it's in the recent betas, and people are debating the exact way it should work right now. There are 'verticalscale' indicators for NT6.5 floating around that try to work around the issue in the meantime, but they are a bit quirky from what I hear. I've never tried any of them.
-
PS. Don't mind the RSI... I forgot to remove it on stockcharts.com

Looks like the RSI finally broke through resistance at 70. Maybe it will become support soon.
FWIW the mindset I keep is the "search for liquidity" one that Blowfish mentioned. I tend to see price as drifting in the direction of least resistance. This means it bounces off areas where lots of orders are. If someone happens to push it to the other side of a highly liquid zone, then it will start bouncing off if it from the other side if people continue placing orders there. Support becomes resistance.
As with all theories like this, I have no way to verify it one way or the other... I just go with what makes the most sense to me with the information I have. In my view, the most important thing is to have a theory in mind that allows you to make confident (and statistically profitable) moves in the market. No time for second-guessing when a trade needs to be put on!
-
I ask because you seem to be talking about one style of teaching/learning and its not necessarily completely applicable to trading.I was really just trying to point out that there is a huge chasm between concepts you grasp and skills that you master.
I thought most people would remember that driving was awkward and error-prone initially, but quickly mastered via guided practice. No one expects to read a forum thread and then know how to drive a car, but sometimes people expect to read a forum thread and know how to trade. So I thought the example would make it clear.
Over time, less intellectual and more effective techniques were developed and an important element was less talk and more modeling and shaping. Watch, do, "try pressing down a little with your big toe", wow. Very personal and very effective.I guess I would say "less intellectual and more experience-oriented," if I understand you correctly. It sounds to me like we are in agreement. What in your opinion can be done in this forum to make the process here more effective?
-
Does it take any occult powers or insightful interpretive powers to see the opportunity offered by setting stop entry orders on either side of that range with profit targets at the nest S/R levels?... and when I opened my 5-minute chart, it had bounced off support so fast I actually jumped in long after what I considered to be a small-scale (pink) HL. I have found drawing in the large-scale (blue) and occasional small-scale (pink) swings a very useful exercise. I really can't thank you enough for inspiring such a simple practice.
.jpg.c486cdfebac86777da6d76e8c5116976.jpg)
-
This is why I dont believe your system or any body else's system can be taught, even though you might on a very rare occosion have a few people that truly understand, I dont believe most will. Not that you are not explaining everything, you do! But most of us will not be able to grasp it.
I don't know you, Don4, so understand that I'm talking in generalizations and not about you personally. Like my last post, I hope this is helpful to at least somebody, and not taken the wrong way.
The analogy I use when I'm teaching people goes like this: I can tell you all about how I drive a car. I can show you videos of me driving a car, and talking about what I'm doing/thinking/feeling. But, no matter how much or how often I do this, you are going to feel awkward the first time you try it. The first several times, even. You are going to make plenty of mistakes, even though driving will eventually be so easy for you that you can do it automatically while daydreaming about something else.
Ultimately, you have to bridge the gap between the world of concepts and the world of experience yourself. That's true for trading, dating, golf, juggling, tight-rope walking, you name it.
But, I think most people would agree with me that this universal fact does not make instruction pointless. It does not mean that driving cannot be taught, as you seem to have concluded with respect to trading. It just means that your concept of education sets your expectations too high. People cannot be fully spoon-fed skills. Can't be jacked-in and receive skills, matrix-style.
I think everyone here knows this, but some would rather tell themselves it's hopeless. Another universal fact is that most people are desperate to protect their ego (or to be more precise, their ego is desperate to protect itself). This leads people to externalize their problems rather than face reality. "If I had a better teacher, then I would understand." "Sure so-and-so can do that stuff... he is a genius/went to a better college/has more experience/had more help/has better tools/is luckier." "Those evil cheating market makers know where my stops are." "This stuff can't really be taught, anyway." etc.
I don't mean to say that all excuses are invalid, but not one of them gets you any closer to success until you identify a positive response to it. Never forget that your ultimate goal is not to feel better about failure. Your ultimate goal is to successfully acquire a skill.
-
I bet that if we would sit with Thales one on one for 1-2 months, most of us would would succeed.
Why? Because that way he could ground you if you repeatedly ignored his suggested path of learning?
I don't understand the turn this thread has taken. This will sound harsh, but it sounds like a lot of excuses are starting to surface. Look, even if you are correct, a negative, defeated mindset like this will never lead to any kind of success. I know it's easier for people to attribute elusive and uncommunicable subconscious filters to Thales, but however good that makes you feel, you aren't even one step closer to winning the game.
Meanwhile, I don't see any posts from people who have stopped trading and talking about points they liked from the Darvas book or Stikky stock charts, etc. Haven't noticed any photos of printed out charts with S/R drawn in by hand. Maybe his daughter's main advantage was actually following the course Thales laid out? Is that such a silly notion that we're all going to assume Thales has occult trading powers without even trying it?
-
FWIW I've been doing nightly "homework" that looks more or less like the attached chart. Basically trying to train my eyes to see the high-level swings by drawing them in by hand. Then labelling the HLs and LHs that break out. I know a lot of trades posted around here come off the "high frequency" wiggles in price... I've noticed that if you use those for tight stops on your entries while focusing only on the slower swings for the actual setup areas, you get smoother breakouts, though. I've posted about this some in other venues before.
I've seen Thales suggest similar exercises several times now, and I think it's kinda weird that I don't see more people trying them. If it's any enticement, I actually think drawing the highs and lows is kinda fun
I know practice isn't as sexy as trading, but I'm certainly not above it when investigating an unfamiliar approach. In the US, our "Thanksgiving" day is coming up, and I'd like to thank Thales for an awesome and informative thread.
.thumb.jpg.648c400bc9c9bea41fbc1851ebd7fd7d.jpg)
-
If I may suggest, can you modify the overlaid chart to the following format?
Here you are. To get the style you wanted (i think? chart attached), select BoxStyle = true, and make sure the penAlpha is like 100 or so. The alpha is important because otherwise you won't be able to see through to the bars beneath. Note that it also now counts in minutes by default (it used to count in bars by default, but some charts have gaps in the data that would throw off the timing).
.thumb.jpg.d7d829f53b8f0afa1a76f076a057641a.jpg)
-
I wish someone would make this version for NT.
I haven't seen anything but the screenshots, but I threw this one for NT together today. It's similar in look to what I saw posted here. Anyway, I attached a snapshot of 15-minute virtual bars on top of 1-minute bars. Maybe it will be of use to you.
Provided as-is, no warranties, and all that stuff.
What I want to do is somehow dock a dial on the left side of the chart, so that you can control the opacity in real-time. That way, you don't have to be staring at the virtual bars unless you want to. Not sure how hard ninja is going to fight me on that front. (I'd then like to attach this dial to all of my price indicators, actually)
.thumb.jpg.a2c56436ea1012f5112b4d575128039e.jpg)
-
The most important thing to remember with the DATA keyword, which constantly trips people up, is that you are accessing the other data only when events happen in the primary data stream. (the primary one is the one you apply the indicator to when you add it to your chart, not necessarily DATA1)
So, if you apply the indicator to a 5-min chart, update-intrabar turned off... then even if Data2 is a 1-tick chart, you will still only run once every 5 minutes, and Close Data2 will be the most recent close for the 1-tick chart, even if you've missed hundreds of 1-tick bars in between.
For this same reason, certain optimizations like AverageFC (which assumes it will "see" every bar it needs to, and only once), and any algorithm that needs to "see" every tick will generally not work across data streams and are best avoided.
Things are a bit more intuitive when you have update intrabar on, but it still pays to keep this in mind. Most errors I come across in multi-data indicators stem from this issue.
-
Does that mean that 50% line is often considered legitimate enough to be used as an entry?If so, it sounds to me that it may be a good place to place stops too. (I am a little confused....)
Well, the reason I asked about research in the first place is: it may well be just fine for the type of trading you are doing, on the markets you are doing it on. The last thing I would do is tell you not to move your stops someplace. You know, it's easy to fall into the pattern of detailed study when it comes to entries, and just wanting rules of thumb when it comes to exits. But, in some ways exits are actually the harder problem!
I will say this: for my style of trading, it pays to anticipate the future, but wait to act until the market shows its hand. In other words, let's say I know from experience that my market often finds support at about a 50% retracement from a big push up. So, when price starts stalling out, I might expect price to retrace half the move and continue. That doesn't mean I'm going to just throw a stop under that level while price is still at the top, and hope for the best. I'll be watching for signs that buyers are stepping in, and once I've seen that, I can require (via my stop) that support hold.
On the other hand, if price blows right through the 50% area, I know buyers didn't step in, and I'm glad my stop is still below the last s/r I actually witnessed. If I know I'm NOT going to be glad to sit through a bigger retracement for some reason, then it's better for me to just exit the trade at the top, rather than gamble on phantom support showing up in the middle. I can always re-enter, after all.
(although in real life I'm better about telling myself I can re-enter than I am about actually re-entering. I have a kind of post-trade euphoria that makes me less sharp for a few minutes after each trade!)
-
I guess Richard asked you, because of these 50 % retracement trade entries.
Maybe he will add something, or correct me.
He had said 'moved up stop to halfway point' as if that were an obvious choice that required no explanation. So, I just wanted to get a sense of how much research had gone into that decision. Like you say, 50% retracements are so common that they are often considered entries, so it didn't make sense to me. I didn't want to criticize the idea without hearing the rationale, though.
The biggest mistake I see my clients make with stops is: they move their stop while thinking about their personal entry price. Of course, the market doesn't know or care where they got in, so they are cutting the cord between their stop placement and their analysis of the market. When they do this, they'd usually make more money by just exiting immediately at the better price, rather than putting their stop in harm's way. Though it's kinda a cliche, I suggest that people try to keep their stop in a place that they don't think price ought to reach... in other words, if price reaches the stop, it would invalidate their reasoning behind the trade. Easier said than done, with money on the line, I know!
-
First target hit, moved up stop to halfway point.This made me wonder: Have you done some sort of analysis that says that price rarely hits the halfway point on the way to the second target?
-
Take a look at the below chart. Can anyone using this chart truly be considered a price action trader?
Discussing what kind of trader someone is by looking at their chart convinces me that we are way too focused on surface details. This is like figuring out what kind of cook someone is by looking in their pantry. At best you can paint broad strokes, you know?
I think this (imho) misplaced indicators-or-not focus hurts newbies, who often come away from these religious discussions thinking that cleaning up their charts will somehow make them profitable. Every time I see them chanting the "indicators are not the answer" mantra, I sigh, because I know that a bare chart isn't the answer, either.
Too often, we're diverting attention from the central issue of being a winning trader. That is, a trader needs an understanding about the way the market works which gives him an edge, and he needs to find opportunities to exploit that understanding. Whether he spots his opportunities with raw data or derived data isn't very important compared to the concepts behind the trade.
I recognize that it's good to warn newbies about the pitfalls of indicators, because they are so attracted to silly recipes like "set it on 14 and buy when the squiggly line crosses -50." But, I've also seen folks proudly remove their indicators, only to proudly drain their account spotting faux "support" and "resistance" all over the place. What's missing in both cases is a working understanding of what the market is trying to tell them. Imagine how much more helpful it would be to keep the focus on that!
Just my two cents.
-
thanks ehorn but this looks like cis it possible to writte these lines in easy language
Your request seems to imply 0-based array indexing, so this would be your "skip 3" code:
vars:
 int indx(0);

arrays:
 srcarr[19](0),  // source array
 dstarr[7](0);   // destination array

// your request said 0-based arrays, so...

for indx = 0 to 6 begin

 dstarr[indx] = srcarr[indx*3];

end;
... but, it's better practice in easylanguage to use a 1-based index, because easylanguage's built-in functions have that perspective. So, your source array's 1 4 7 10 etc... would map to your destination 1 2 3 4 etc...
vars:
 int indx(0);

arrays:
 srcarr[19](0),  // source array
 dstarr[7](0);   // destination array

// use 1-based indexing this time....

for indx = 1 to 7 begin

 dstarr[indx] = srcarr[indx*3-2];

end;
-
I was reading through this thread, and decided to play with it on ninja replay... well, like many indicators, the bands and adxvma start from 0 and work their way up to price. On a replay that starts at midnight with no history before that, this means that it takes a while for the indicators to get anywhere near my bars and my price scale is all screwed up.
This is usually not necessary, though, and a couple changes eliminate the issue for me:
In fantailvma1 the 'else' case when amaData.Count <= 1 can be changed to: amaData.Set(Input[0]);
... so that the vma starts on price for the first couple bars. You can see that, after enough bars pass, the old and new versions converge.
In the adxvma, same thing, in the CurrentBar < 2 case, instead of setting ADXVMAPlot to 0, set it to Input[0].
This made it testable on replay for me, anyway, so I thought I'd share.
-
As a suggestion, people prone to overtrading may want to try focusing on the 15-minute charts for a while. It's helped me, in the past.
Speaking of which, I'm starting to think it might be useful to go over 1, 15, and 30 minute charts at night, with the purpose of figuring out how to spot their best setups on the 5-minute chart. If I'm going to stick with the Brooks 1-chart mandate, it might be good practice. For instance, look at how clear the ii setup is at 2:30 to 2:45 on the 15-minute chart today (sorry, not at my trading machine so using bigcharts on SPY with no annotation):

... and look at how relatively unclear it is on the 5-minute chart (I didn't make a trade here because it seemed so noisy):
If I had been able to recognize what it would have looked like on the higher timeframe, though, it would have been a nice trade.
-
Here was the only other Brooks-style trade I made today.
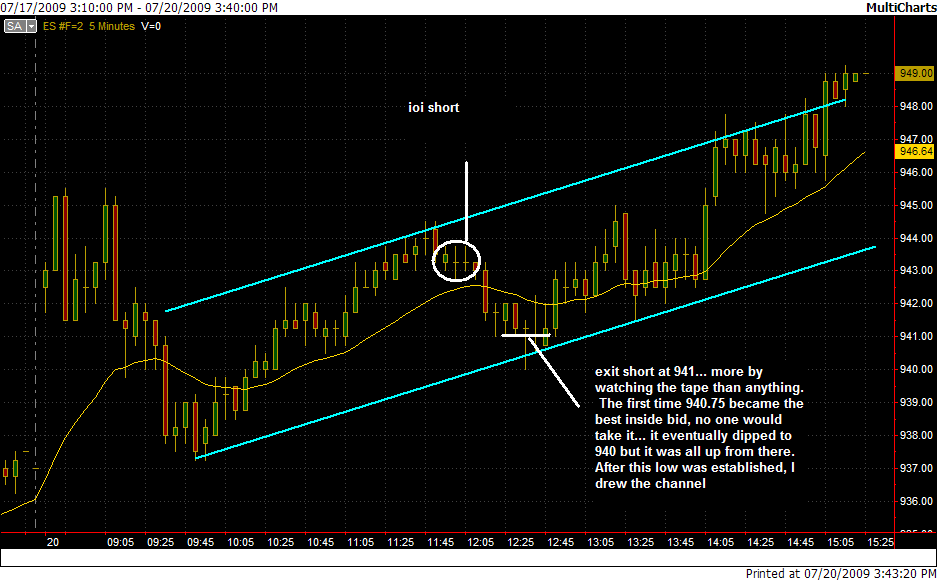
I'm not sure how great it was, because I was looking at the run up to 944ish as a wedge-shaped pattern, and was looking for more of a retest of the breakdown before getting short... but I remembered the ioi discussion in the book, and went for it.
The low from that trade established a channel that held the rest of the day, but from a Brooks perspective, I didn't see any more entries that I liked. Probably just inexperience with the method... but all the overlapping candles made me hesitant. I generally trade much smoother looking charts than the 5min, but I'm trying hard to evaluate this method on its own turf, so to speak.
-
Here's what I did in the first hour off my "brooksy" chart... again, I was trading in terms of the range defined by the first few bars. Again, I entered long after a red doji bar, which I've been warned about. This time, it failed on me, but I took the reversal (failed failure to break down from the range), and it more than made up for the loss.
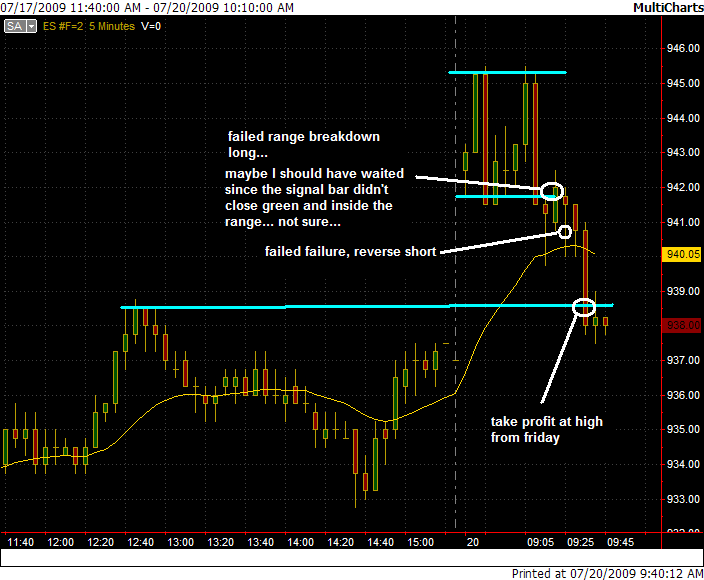
I haven't seen much in the book about taking profits, other than scalp out and maybe swing a portion of the position... so I chose a peak from Friday to exit. Time will tell if that was too early or not.
At the level I'm at with this stuff, my other trading styles are far more profitable for me. So, I'm going to try to step up my 'brooks' game soon. I may try to start doing the h1/h2 labelling after hours, to see if I can grok it, but during the day I'm still just keeping it simple.
-
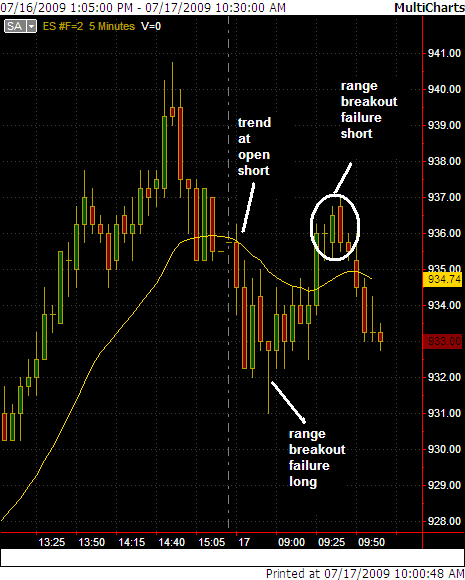
FWIW, here's how I would have analyzed yesterday from my basic Brooksian perspective. Disclaimer, I just now marked this up and didn't trade it. But it's consistent with what I did today in realtime. Pretty sparse, no? As long as the MA stays in the middle of the action, I am just looking for range breakouts to fail. Perhaps with more practice I could do more sophisticated labelling and get more out of the inside of the movements.
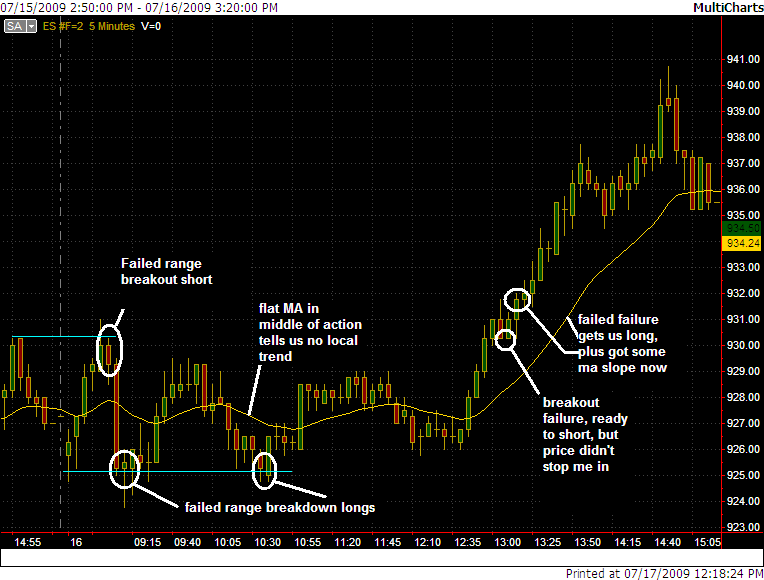
My impression of the Brooks stuff so far, is that it encourages people to assign so much significance to every bar that they start missing the forest for all the trees. As an indicator guy, I find myself leaning on that single MA quite a bit to remind me that--no matter how interesting the bars look--there is no local trend a lot of the time.
-
Your chart and trade locations look good to me. The bottom Long setup did not show a Trendline break which Brooks likes to see ... but this on this OEX range day those entries would have worked nicely.They worked well, for sure. I think at least a few in my audience were impressed enough to check out the book, which is what I wanted. I try to get people to investigate as many trading styles as they can.
I just wasn't positive everything I did would be Brooks-approved... I try to distill it to the basics... doji vs trend bar, trend vs. trading range. Stay with the trend, fade the range. I have yet to go labelling my bars H1 H3 etc. To be honest, that part kinda confuses me.
Does Brooks call for a trendline break to reverse in a trading range? I thought any range breakout failure was fair game?
So far the range call looks good. The problems I see are that the failure at the bottom, despite the overshoot, was a bad looking (bear doji instead of bull trend) reversal bar and the failure at the top never gave a second entry.Thanks for your feedback. Yes, it was a doji candle, true enough. I'll have to ponder that. Still not sure why everyone is talking about trend overshoots in a trading range, though. The three candles prior to the reversal bar nearly completely overlap, and to my way of thinking the first three 5-minute bars form a usable "opening range" regardless.
Do I need a second entry on a range breakout failure? I thought Brooks would pretty much fade the breakouts on the first failure, right?
Or is it that I am seeing this all as a range, and you all see trends inside it?
There was the good breakout trade at the open that was a good short. And I've noticed that the first reversal bar in the a.m. is usually good for at least a scalp which it was.If they correspond with overnight S/R zones, I often scalp them as well.
Anyway, thank you for your feedback, and any clarification (even if you just point me to the right chapter in the book I can do the work) on needing a trendline break to take a failed range breakout would be appreciated.
I got long again at 933 off the 11:00 central time bar, after yet another breakdown failure on the 10:50 central time candle. To me, the 10:50 candle was too tall (reaching the 20ema) to take safely, so I waited. I guess this is another case of me getting in off a doji bar rather than a trend bar, like ACS points out. I need to think on this further, from a Brooks perspective. I know I saw somewhere in the book a case or two where he did a similar thing (saying something like "a tiny trading range at the bottom of a bigger trading range" was ok... too much info in that book, and not very well organized imho). Now I'm done for the day.
-
I have been going over some Brooksian-style analysis in our live room today. Trying to get everyone I can to at least look at the book, in case it fits their personality. I thought I'd show you the way I've been calling it today thus far. Any comments are appreciated, because I'm no Brooks expert. I just try to ape the basic principles as I understand them so far, so please tell me what I'm doing wrong.
Basically, I've seen today as a big trading range so far, and except for scalping the opening move down, I've been watching for the failed breakouts. To me, you can spot the range either through all the sideways overlapping candles, or by knowing the S/R from overnight, or just by noting that the MA is flat and in the middle of the action. Seems to be working ok. If I see a breakout that retests the breakout and runs, I'll start looking for trend plays.
-
Trade 1 was an L1 short. Felt like a breakout pullback from LOD, certainly didn't trade like one. Came after a doji, any other reasons not to take this trade? (Traders took the H2, and the trapped L1s [myself] covered and brought the market back up).I think Brooks talks somewhere about outside bars being trading ranges, and so far I'm finding it can pay off to treat most wide range bars like a Brooks "trading range." Especially if it's not followed by more trend bars in the same direction. I wonder if anyone else has the same experience?
Anyway, that 9:05 (central time) bar was relatively wide. So, if I take the "trading range" perspective, the pullback entry would be too close to the bottom of the range. Brooks seems to emphasize quite a bit not to go short at bottoms of ranges. (at least in the parts of the book I've read so far)
The only other observation I can make is that the moving average was flat and right in the middle of the action during the morning, which to me says there's no local trend, and the overall daily trend is decidedly up right now. So, a downside breakout would be a countertrend play, no? Also something Brooks seems pretty strict about avoiding, as far as I can tell.
I'm not sure how helpful that is or not because I haven't finished reading the book and I've only traded my best imitation of his method a couple times for fun. In particular I haven't read the chapter about the opening hour, so maybe he says countertrend breakouts are ok to take. But, what I said makes sense to me, for whatever that's worth.
Other examples of wide-range bar "trading ranges" would be the 10:35 bar from the 13th (can be treated like a range break-out that you'd hold off on until it tests the top of the bar's range before going further up), or the 9:00 and 9:15 bars on the 10th.
-
(As an aside, a discussion of distribution skew, also called kurtosis, can be found at this Wikipedia site.
I realize I am nitpicking a 2-year-old post, and I apologize for that. But, I'm just now seeing this thread and I have to point out that Skew is not also called Kurtosis. Kurtosis is the 4th moment of a distribution, while Skew is the 3rd.
I'm enjoying looking through these threads. Thank you for them.
.jpg.5a86de5d431269bf74b19110baed4e3e.jpg)
.jpg.c3fc2e39768bc8449749abbd16e6943d.jpg)
.jpg.df5b0094c448e72132462ed7aeedf0ad.jpg)
Reading Charts in Real Time
in General Trading
Posted
The NT7 feature works like this at present: you can fix the scale to a range, like 1100 to 1120 on ES, say (NOT points per inch, which is what some want). And, once you fix the range, the bars will then run right off the chart until you move the visible window by pressing control and dragging on the y-axis with the mouse. So, some people would like it to work more like tradestation where it will center the last traded price, or at least keep the current bar visible if you are watching the right-hand edge. Others would be happy if you could just drag the mouse on the main window (like you can for the x-axis already).