
Welcome to the new Traders Laboratory! Please bear with us as we finish the migration over the next few days. If you find any issues, want to leave feedback, get in touch with us, or offer suggestions please post to the Support forum here.


insideday
-
Content Count
30 -
Joined
-
Last visited
Posts posted by insideday
-
-
@swisstrader
On markets like the FDAX there are a lot of trades TS reports between insidebid and insideask. How does your code handle this? Do you look if the trade before was on bis/ask or do you ignore these?
-
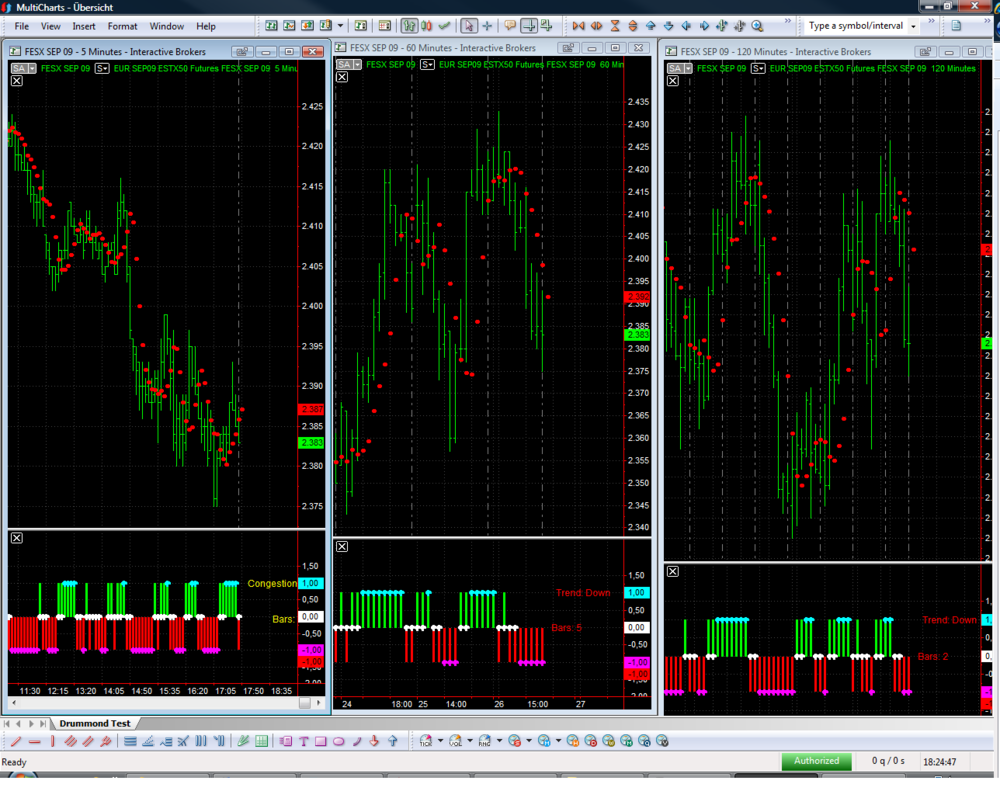
Marplex has posted a nice indicator and video for S/R zones. Program 16 | Potential Horizontal and Vertical Turning Lines
It counts how often a zigzag extreme occurred at the same levels and then plots the highest values.
-
-
cunparis, i only watched it the last minutes on ES,
but couldnt it be easy something like this on a 1 minute chart
input : ESsize (20);
if high >= highest (high,3) and tradesize at ask>=ESsize then beep/alert
if low<= lowest(low,3) and tradesize at bid>=ESsize then beep/alert
?
i am sure that htey dont use a complicated tick/volume chart.
-
-
Szymon,
this gives you the angle
Input: Price(Close), NumBars(1), MA_length(20);
variable: MA(0), slope(0);

MA = average(price, MA_length);
slope = arctangent((MA - MA[NumBars])/NumBars);

plot1(slope, "slope");
plot2(0,"Zero");


If you need the the degrees instead of the radians change

slope = arctangent((MA - MA[NumBars])/NumBars);

to
slope = arctangent((MA - MA[NumBars])/NumBars)*180/3.141592654;
-
Hi Tams,
if a specific condition is met, i want to delete the rectangle. Does somebody has an easy solutiion where to put in the 4 tl_delete. Into the function before if value1 = 0 then or into the main code?
-
I am not sure about Futures like Currency futures on the CME. I will have to do some more homework on these.They changed the behavior for the Currency futures some weeks ago. I wondered some weeks ago why the T/S shows 1 lot trades on over 97 % compared to the days before.
-
This is the function i programmed for one code, maybe it fits your needs.
inputs: _Color (NumericSimple), _DateStart (NumericSimple), _TimeStart (NumericSimple), _DateEnd (NumericSimple), _TimeEnd (NumericSimple), _PriceHi (NumericSimple), _PriceLo (NumericSimple), _Size (NumericSimple), _Style (NumericSimple); Vars: Top (0), Bottom(0), BarrierLeft(0), BarrierRight(0); Bottom = tl_new_s(_DateStart, _TimeStart, _PriceLo,_DateEnd, _TimeEnd, _PriceLo); tl_setcolor (Bottom,_Color); TL_SetSize (Bottom, _Size); TL_SetStyle(Bottom, _Style); Top = tl_new_s(_DateStart, _TimeStart, _PriceHi,_DateEnd, _TimeEnd,_PriceHi); tl_setcolor (Top ,_Color); TL_SetSize (Top , _Size); TL_SetStyle(Top , _Style); BarrierLeft = tl_new_s(_DateStart, _TimeStart, _PriceLo, _DateStart, _TimeStart, _PriceHi); tl_setcolor (BarrierLeft,_Color); TL_SetSize (BarrierLeft, _Size); TL_SetStyle(BarrierLeft, _Style); BarrierRight = tl_new_s(_DateEnd, _TimeEnd, _PriceLo, _DateEnd, _TimeEnd, _PriceHi); tl_setcolor (BarrierRight,_Color); TL_SetSize (BarrierRight, _Size); TL_SetStyle(BarrierRight, _Style); DrawBox2MC=0; -
@Urma
What is the highest timeframe for that calculation of the GV?
-
Thanks. I begin to program some of the “R-Vals” described in the pdf on the bottom of the page
DG2 New Concepts Software – Drummond Geometry
Do you have some experience which are worth to put some effort in ?
-
Does somebody use the 5.. and 6... lines described in their lesson 2 in his actual trading or are these ideas out of date especially for intraday trading?
-
I know. If i read goose posting correct, TS 9 will changed completely, offering a TS "Strategy Network" and marketplace which allows developers to upload their codes to a network like collective2.
https://www.tradestation.com/Discussions/Topic.aspx?Topic_ID=90402&PAGE=3
-
MC can only import TS eld from TS 8.3 and earlier. It will probably not import any eld from 8.5 onwards. Use copy and paste and it should work with a little more customizing.
I have no problems importing ELDs which i exported with TS 8.6 2525.
-
This one worked for me in MC
inputs: HOffset (2), VOffset (2), AlertLevel (50), TextColor (White), AlertColor(yellow); vars: txt (0), str (" "), Count (0), CountTotal(0), price (0); price = close; // price at which the text will be printed if BarStatus(1) = 0 then //opening tick of each new bar ...so reset params to Zero begin count = 0; CountTotal = 0; str = " "; end; count = upticks + downticks; // total the volume during the bar CountTotal = BarInterval - count; // Subtract the volume from the Bar Interval Total str = " "+numtostr(CountTotal,0); // Convert the remaining count to text if Barnumber = 1 then // First bar print the number text begin txt = text_new(date,Calctime( Time, HOffset),close ,str); text_SetStyle(txt,0,VOffset); text_SetColor(txt,TextColor); end else begin // 'move' the number to the right, update it, instead of delete and redraw. Mo' efficient. text_SetString(txt,str); text_SetColor(txt,TextColor); text_SetLocation_s(txt,date,time_s, (h+l)/2); end; {//see if time for alert if CountTotal <= AlertLevel then begin text_SetColor(txt,AlertColor); alert("Less than " + numtostr(AlertLevel,0)+" Shares Remaining !"); end; } -
comparing the closes to each other works relatively well; but one needs to make assumptions/avg through the up/down pressure (ie order book) based on relative closes and closes that don't move. That's where i magic will be, in my humble opinion
phall
I dont know if this is what you search, but for Ninjatrader the jtRealStats indicator shows on the right side, tick by tick, how much volume is occurring above, at and below the previous bar's closing price. I am sure thsi could be also plotted as histogramm changing some lines.
-
Shouldnt it be dtrend= - dtrend1 -dtrend2-dtrend3-dtrend4-dtrend5-dtrend6;
, else you could get dtrend values greater than zero?
-
In my opinion the premarket solution isnt really a improvement, because you only get 1 or 2 trades in this premarket time range. Why dont he use the systems as meta indicator? If x % of the 50 systems give a buy signal then buy...
-
BTW, does anyone have the link for the thread on the TS forum for voting on the necessity of having T&S data for EL?
https://www.tradestation.com/Discussions/Topic.aspx?Topic_ID=24606
-
swisstrader,
did you also remove the problem that ant's code often calculates the B/A different to the values of the times & sales due to the tradestation ELD limitations?
-
It is a combination of the functions: FastD, LinearRegAngle, LinearRegSlope, SwingIndex and a close <> a moving average.
Yuu could try to find a combination for yourself that fits your style.
-
Please ignore my previous post. There is a failure in the code.
-
@ traderlu
Very nice code.
I added for myself an filter to avoid plotting in chop zones. After an extreme is found the opposite point must be a minimum distance away from the last extreme.
-
Hi PivotProfile,
interesting read. I am not familiar with metastock, so i have a question. Does C>ref(C,+1) look one bar in the future?
If yes then your
NoDemand:=If(H>ref(H,-1) and L>=ref(L,-1) and (H-L)<=ref((H-L),-1) and V<ref(V,-1) and V<ref(V,-2) and C>ref(C,+1) and H>=ref(H,+1),1,0);
should look in tradestation like
condition1= H[1]>H[2] and L[1]>=L[2] and Range[1]<= Range[2] and V[1]<V[2] and V[2]<V[3] and C[1]>C and H[1]>=H;
if condition1 then
plot1(1);

"Market Delta" Footprint for TradeStation
in Trading Indicators
Posted
Thanks for the clarification. With the equality sign at CloseOfData <= LastC_Cache we have a slight bias to the bid side.
Did you compared the results with the original Marketdelta program?