
Welcome to the new Traders Laboratory! Please bear with us as we finish the migration over the next few days. If you find any issues, want to leave feedback, get in touch with us, or offer suggestions please post to the Support forum here.

VTK
-
Content Count
69 -
Joined
-
Last visited
Posts posted by VTK
-
-
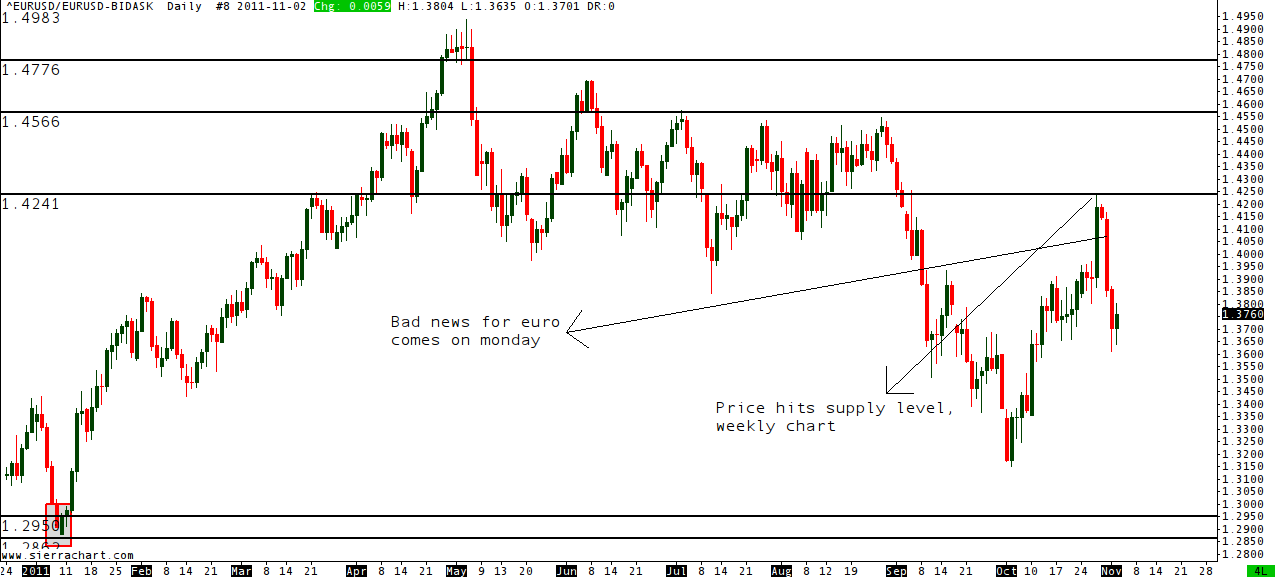
Here is something that i find most interesting.It's like price is anticipating an event.
Have noticed same thing when US got downgraded,S&P was at big picture supply,trading lower for couple of days and than the news came out.
http://www.sierrachart.com/userimages/upload_2/1320229393226.png
-
Here is article which i got as weekly OTA Lessons from the Pros article series.
The Three D Process: It's For Your Progress
Hope you peeps will enjoy it!

-
Would like to add another fantastic book.At least it's part about mind.
John Hayden:"The 21 Irrefutable Truths of Trading: A Trader's Guide to Developing a Mind to Win"
I am big believer in fact(at least for me:) ) that trading is 90% psychology and 10% the rest.
Have had such experience which made me think like that.To master the market you have to master your self;)
-
I think rally, base drops should be at swing highs and lows and not in the middle of the moves.Yup,it's like rubber band.More stretched price is greater the odds that it will turn around.Usually i don't do anything when price is "in the middle",right between two key areas of S/D.
Remember the win/loss ratio isn't a high percentage for S&D as told to me......Wouldn't agree at all!
It's quite individual meaning that personal experience,understanding,approach...will determine ones W/L ratio.And after all W/L figure is not important.Profit factor is important.
-
The way that I see and trade it is to always look for timeframes of confluence.Derutrader,douletop is right.Sam picked lowest level as it was drop-base-rally on higher timeframe like 60 or 30.
Also when going for extremes,one side will be exhausted and profit margin will be much nicer.Think of it as you are stretching rubber band.More you stretch it more it will snap back eventually.
-
Here is how USDCAD trade ended up.Risk/reward 1:7

Cheers!
-
Is it really worth your time? I also wouldn't pay a dime to someone who programmed something like this when I can spot the patterns myself for free and while doing so might learn something about the chart I'm looking at... :missy:
Great attitude mate!
Also i would add that it's quite easy to spot those S/D levels just by looking for strong rallies or drops.
By the way VTK, I enjoy having this discussion, please don't think I'm being argumentative or picking an argument here ;-)No worries mate.I can sense hostility.That's why i was so direct with Gabe..
We have no idea, and never will, WHY demand was greater.I agree with you and to tell you the truth i don't care for exact reason as long as i can find S/D patterns on chart.
Support and resistance levels (or call them supply and demand levels) only "work" for one reason--traders pay attention to them. Prior supply and demand at a price is only significant if enough traders TODAY put significance on that price and want to buy or sell it.
I am taught to think in terms of order flow.So how it usually looked on CME for Sam-is transfered into mine way of thinking about S/D.He worked on a desk where he was getting orders by phone from big institutions.And for example he had really big stack of orders to buy Yen between 81.15 and 81
Let's say that price was falling for some time and it was at 81.50.As it was getting closer to 81.15 phones would start to ring and people were excited and wanted to sell after drop in price.Those were generally retail/novice traders.As soon as price came to 81.15-81 area of demand buy orders were filled and when last sell order was filled price would go higher usually leaving unfilled buy orders at area of demand.So when price came next time to same area of demand it met unfilled buy orders and if there were enough of them it rose again from the level.
I am not countering you here or anything.Just wanna show you way i see whole stuff.Basically i told and explained my self in previous posts and there is not much more to say.I'm fine with different views of others as mine edge is in thinking differently than majority.
Just to put picture to words here is long on USDCAD that hit limit last night.
Best,cheers!

-
I've never heard anybody call a fib retracement, MA, or pivot point "support" or "resistance." A moving average is a measure of value--it's the mean price over the last X bars, whether that be closing price, typical price, or whatever. A pivot point, if you mean a pivot calculated using something like (H+L+C)/3 or any other formula, is again a measure of value. Nowhere is there implied that there's some type of support or resistance associated with either of those.We're really just parsing words--"support" means buyers bought and "supported" price. There was enough demand at that level to cause prices to rise from there. It's just terminology, and Sam does a very good job at making "supply and demand" sound unique, but it's all different terms for the same thing. I actually like the terms supply and demand better, but to say that they are fundamentally different from support and resistance is a mistake, IMO. If you disagree I'd like to know exactly how they are different.
Hey Josh...
A fib. trader would pick something like 61.8% retracement,wrap some rules around it and trade it as he/she would assume that price found sup/res.I have heard many times people saying price found sup/res at MA.
If you look at the chart you will see that MA alone gave sup/res only once, but it failed miserably most of the time.But when it was in confluence with S/D level it worked fine.Note that in this example it's same with 61.8.
Both fib and MA could be understood as sup/res but more often than not they work fine when they are in confluence with S/D levels.
So for me one is illusion other is reality.If you look just at terminology it's same thing i agree with you but technically it could be understood differently so i like to call those levels for what they are representing-supply and demand imbalances.

Best,
VTK
P.S.
Sorry for messy chart!

-
You foul language is reason enough to put you on my ignor list.Although you can't see it-God bless you Gabe:)
-
You did not answer the question and you keep up with your insulting replies so make up your mind. Do you want to explain in a civilized way like Blowfish for instance or you want to show off.(and BTW Sam is using Supply/Demand and Support/Resistance interchangeably - just look at some of his charts).Also I am not spitting my anger on others (I wonder who they are) I am just pointing out that Sam is inconcistant at times and when there is a conflicting point or an ambiguous point, he does not respomd to questions.
Which question did i not answer?

Are you bit slow pal or it's just denial-anger-acceptance when it comes to you?
Me insulting you!?What i said was obvious from your posts.People doesn't like to hear truth and it makes them mad.
Was looking on his charts for couple of years and he always told us to call things as they are-supply and demand.Sup/res can mean fib.ret. MA,pivot point or whatever.
I don't see any inconsistancy in his work.If you do and you are interested into subject-study harder.Always someone other is guilty:roll eyes:
I have paid for OTA XLT and yes he didn't answer any emails that i have send to him
but i did not come to forum to cry about it.Steve Misic was there to reply on my mails and he is also great guy and student of Sam for more than a decade.
And what a wonder!Even without Sam's replies i am doing fine!
-
Sam's DEMAND ZONE does not look different than some time before it was marked as such whereas my demand zone (or what i would call a demand zone shows significant support or DEMAND as price bounced off of it many times over the years.What gives?
"...what i would call a demand zone..." is pretty much toasted in context of sup/dem levels as price went thru it in 2010.Don't mix conventional concept of support and resistance with supply and demand areas.
Conventional sup/res says that more times area is tested stronger it is.For me it is same as saying that i would be more fine if get 4-5 punches into my head than just one.
Think about orders at those levels.Every time price visits level orders are filled.So eventually it will go thru it.
What you have marked as "Sam's DEMAND zone" is fresh level,it worked just fine and i don't see what's your problem with it.
Here is another example.The chart with the white background is Sam's. The one with the black background shows a larger span and Sam's chart area is marked in blue and his DEMAND ZONE is white.
I cannot see why he would call that a demand zone.
The only thing that might stand out is that price broke above a previous peak and then returned to it.
Why the other retracements are NOT considered DEMAND is beyond me.
Drop-base-rally is picture of demand on chart.On black chart in marked area you can clearly see that picture.That's why he calls it demand,simple as that.Other retracements marked on his chart were low or lower probability and one that he took was highest probability area which you can see based on price reaction.How to "distill"
levels based on probability of outcome is the trick that makes or breaks.For that we are using odd enhancers.
"Why the other retracements are NOT considered DEMAND is beyond me"....because you didn't study this stuff enough to get it and that's fine.But don't spit anger on others if problem lies within you.That's why i called you frustrated:2c:
Hope this helps Gabe...
Cheers!
-
On second thought, why don't you explain the discrepancy - since you are soooooooooo smart .I am not "soooooooooo smart"...just more patient and less frustrated than you are.
I don't see any "discrepancy".If you could be specific i would be more than happy to give mine best to clear out any misunderstanding.
Regards...
-
Attached is a chart for BP going back to 1984.
You can see that there was nothing special with the DEMAND zone of Sam.
Not to mention that this is a monthly chart and I don't know too many people who trade off the monthlies.
If you don't understand this strategy than it's your own problem.Don't throw it on anyone else:helloooo:
..."nothing special" about that rally-base-rally based on what?Your experience with this strategy?
If level is marked on monthly it doesn't mean that trade was took from same chart.
So next time before you jump in front of gun think twice.Trying to understand something before a priori shitting on it is good thing.
-
Just an example of Sam Seiden's manipulative and inconcistant method. Not to talk about lack of customer service skills.On the left is one of Sam's charts and on the right is my question to him which he never answered.
If there was NO DEMAND in the area that Sam marked as such, why is it that price bounced off of that area 20$-40$ effectively doubling the stock price.
It looks like a DEMAND area to me.....

I have to agree with you,Sam is bit notorious about email replies.On other hand his inbox is stuffed with emails like yours.
About your question..Doubletop is right about number of level retest...as i draw levels i would say that price barely touched level once in 2003 with strong reaction of price.Just look at the wick.
In mine book that's sing of big imbalance as price couldn't penetrate deeper into level than touching it and level is still fresh especially because of timeframe which is monthly.
Notice that price went much deeper second time when it came into level in 2009.Also notice how strong reaction was.So when it came third time back into level in 2010,level definitely was not fresh anymore.It's like chopping the tree.With every chop there is less and less "meat".
That doesn't mean that one couldn't pull out a day trade when price came third time into level.Going long from something like 2 min chart would be option for me if i see quality level.
Regards!
-
Here is another Sam's article from March.It's really deep and almost spiritual:)
Lessons from the Pros - 03/01/2011 Issue - Featured Article: Don't Be Afraid
Regards!
-
-
Hi folks!
It seems that i am not able to add signature because i need to have at least 150 posts for that!?
Is this correct?
If it is it's silly at least and this will be first time on any forum that i see such restriction.
Didn't manage to find "edit signature" in user CP...
-
I didn't mention those APA zones and i don't know anything about them.
P.S.
English is not mine native language so give me a break from all that laugh because one error...:security:
-
Basically, Seiden's appear to be roughly centered around horizontal 'congestions'.
That's because those 'congestions' represent "equilibrium" between supply and demand.As soon as last order on one side is filled price will move away from area of basing.In that case area of basing is area for which we can tell that there are more buyers than sellers or other way around.
joshdance, re..:--the difficulty in trading is essentially this--will the market reverse at this area, trade through the area, or rotate around the area?"
Simple laws of supply and demand are guarantee that there are price levels where odds are highly in mine favor so i just look for those areas to solve those dilemmas.
By quantifying supply and demand of any market it's possible to anticipate next move of price with quite high degree of accuracy.
Just look below at SPX500 monthly...When price is so high on chart and it reaches quality supply level like it did it just can't pierce thru it like it wasn't there because supply exceeds demand at the level.Same is for lower demand level.It can't just run thru it as price is quite stretched and it's reaching quality demand level.
http://img683.imageshack.us/img683/6578/spx500.png' alt='spx500.png'>
For me,looking at the markets thru googles of supply and demand made all the difference when it comes to trading.
-
The ability to do this, IMO, is what makes a trader successful. I think having the "map" is essential and is part of a good plan, but knowing how to actually read the map, and then drive and navigate the roads, is where the skill lies.
Good one Josh!
Actually all of us are dealing with odds.Being able to pinpoint when odds are highly in our favor and when not is essential thing.In other post in regard Sam's strategy you have said;"...and notice how well it works sometimes, and how miserably it fails at others."
Guess what..again it's about odds.And that is why i am using odd enhancers to figure out are odds in mine favor or not.As i said earlier there are bunch of supply/demand levels all over the place on all timeframes.If it would be easy as picking any level and making money out of it then me and others using this strategy wouldn't have any edge.
Being able to pinpoint key levels of supply and demand "is where the skill lies" when it comes to this strategy.
Cheers!
-
Does anyone know how Seiden would handle absence of these zones in recent part of chart?
If there is no quality levels at the moment or price is around sup/dem equilibrium then we wait until it comes to a level which meets our criteria.
-
I would say right mindset!
Just recall turtle traders.Many of them were not able to apply strategy that was pulling out money from market.All just because issues within scull.
-
But I want to create my own program. Now I'm so sad.No need to create a program to recognize those patterns if one knows what he/she is doing.
I see those patterns all over the place on any timeframe but that doesn't mean that i am trading every single one.Would go broke sooner than later by doing it so:)
In his FXStreet videos Sam explains how to draw lines around levels so if you are interested take some time and watch those vids.Better to hear it from tha man than from my self;)
-
When you see that narrow band of consolidation in price on a chart, he says that it represents the Bank Order Flow.
Most of stuff that we see on charts is representing bank order flow as banks are running the show in FX.
Area of consolidation is where it appears that supply and demand are in balance(they never are in total balance)
When strong move happens after some consolidation that is indicating imbalance of supply/demand equation.Stronger the move-stronger the imbalance is.Usually volume on best levels is low as few orders were filled.So when price comes back it usually meet significant amount of willing buyers/sellers.Those are trades that i am looking for.
When i sell,i sell to someone who is buying after rally in price at price level where supply exceeds demand.Other way around when buying..Basically,as Sam likes to say,we are identifying novice traders and those guys are other sides of our trades.
Cheers!


Trading - a Psychological Game ?
in Beginners Forum
Posted
You're most welcome zdo:)