
Welcome to the new Traders Laboratory! Please bear with us as we finish the migration over the next few days. If you find any issues, want to leave feedback, get in touch with us, or offer suggestions please post to the Support forum here.

Trendup_
-
Content Count
138 -
Joined
-
Last visited
Posts posted by Trendup_
-
-
I tried to use Excel 2002, but didn’t win, I am completely lost.
Could it be a too old Excel? Did someone find the doc helpful??
-
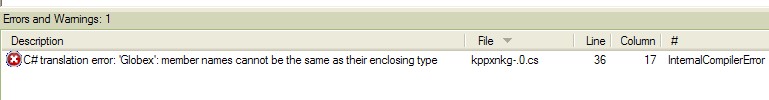
Hi, can't compile the coding, got the following error (attached).
Any ideas?
Thanks
Here's the code from this thread that will plot the Globex High and Low in OEC.Inputs: Session_Start(930), Session_End(1615); vars: G_H(0), G_L(0), Globex(false); If Globex and Time >= Session_Start and time < Session_End then Globex = false; if Globex = false and Time >= Session_End then begin // Should only execute first tick of Globex session G_H=High; G_L=Low; Globex = True; end; If Globex then begin If High>G_H then G_H=High; if Low< G_L then G_L=low; end; Plot1(G_H,"G-High"); Plot2(G_L,"G-Low");
Note - as the code stands currently, it will include data from Sunday, which means your Mon charts will actually be off if comparing the high/low to what the CME is reporting. Another post made to see if there's a workaround to this by trader273.
-
I’m not sure if I do the right thing but since the last OEC update the code doesn’t compile anymore.
I really appreciate that you are developing POC VAL VAH, is there a new coding available?
Thanks
Thanks, I think I figured the VAL calulations out. I checked and it looks like intrabar persistance is not available on OEC. Here's the new code that also plots developing value areas.//PopStocks PVP
Vars: Counter, Op(0), Ct(0), hh(0), f(0), indx(0), mintick(0);
Array: v[800](0), p[800](0), uvc[800](0);
mintick=minmove/pricescale;
If 1 = 1 then Ct =1+Ct;
If Date>Date[1] or Ct = 1 then begin
Op = Open-((800*mintick)/2);
For Counter = 1 to 800
begin
p[Counter] = 0;
v[Counter] = 0;
End;
End;
For Counter = 1 to 800
begin
p[Counter] = (Counter*mintick)+Op;
If Close = p[Counter] then v[Counter]= volume+v[Counter];
End;
hh = highestarray(v,800);
if hh> hh[1] then f = close;
if hh> hh[1] then for Counter = 1 to 800 begin
uvc[Counter] = 0;
end;
for Counter = 1 to (800-indx) begin
uvc[Counter]=v[Counter+indx+1];
end;
For Counter = 1 to 800
begin
If f = p[Counter] then indx = Counter;
End;
Plot1(f);
Plot2(f-(standarddevarray(v,indx,1)/highestarray(v,800)*50));
Plot3(f+(standarddevarray(uvc,800-indx,1)/highestarray(v,800)*50));
-
Thanks for replying, so far no luck in finding the EL code.
If there's EL code for it, more than likely it can be installed into the OEC software. See if you can find the EL code somewhere (might be on this forum).If not, we can suggest it to OEC for a future release.
-
Can’t find the TPO value lines in OEC, Can someone assist to display POC, VAH and VAL lines.
Is the EL code available?
Thanks
-
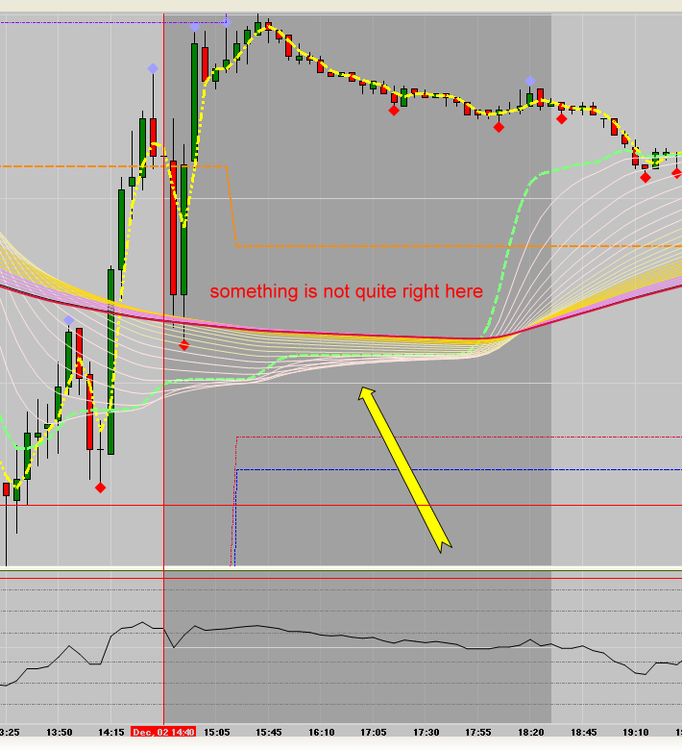
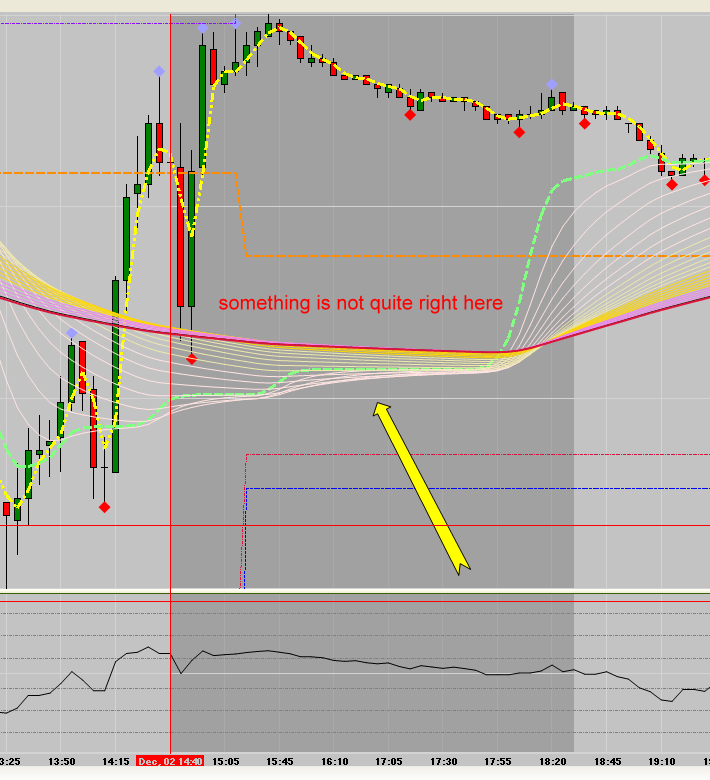
Can someone have any idea why the VMA1 did not follow the price in the attached file? I don’t see that behaviour any where else.
Thanks.
PS: the yellow line is a triangular MA.
-
Wrong thread. I have to post elsewhere.
-
I’d like to use VMARs in Sierra Chart software but I don’t know where to start, any help will be much appreciated.
Thanks
-
I've read Market Statistics by Jerry, excellent thread, the videos are addictives, really appreciated.
I need the VWAP Bands for Sierra Chart, any help would be greatly appreciated.
Thanks
-
I've just read Market Statistics by Jerry, excellent thread, the videos are addictives, really appreciated.
I'm a sierra chart user and have difficulties to find the indicators; I saw multiple threads in SC forum with no solutions.
Any help would be greatly appreciated.
-
I use OEC but I use SierraChart for charting. Feel free to ask me anything you want about OEC.Is it possible to implement The Market Statistics described by JERRY using OEC or Sierra Chart ?
I tried using Sierra Chart and found the vwap different and couldn't find the SD as per Market Statistics part IV.
I haven't try OEC custom indicators yet.
-
I use Qlock, a lot of features time, sync, alarms, colors, sounds, currency, RSS feed etc...I like it…
Rubber Band Indicator
in Trading Indicators
Posted
Interesting indicator, just by observation the rubber band (pink lines, original color) are not expanding in the same scale when going under water line than it does above zero, is it possible to adjust that discrepantly ?