
Welcome to the new Traders Laboratory! Please bear with us as we finish the migration over the next few days. If you find any issues, want to leave feedback, get in touch with us, or offer suggestions please post to the Support forum here.

Trendup_
-
Content Count
138 -
Joined
-
Last visited
Posts posted by Trendup_
-
-
Has someone been successful in installing Heikin Ashi candles in OEC platform?
-
I'd say, not breathing could be the most detrimental mistake for us traders.
Often,I find myself in apnea and have to adjust my respiration.
-
Problem solved.:applaud::applaud:
-
Minute charts seem to be ok but tick, range and volume are affected due to bad data during the weekend, Could be cause by the daylight saving......
As a result indicators are skewed and pivot points in wrong places. So watch out.

-
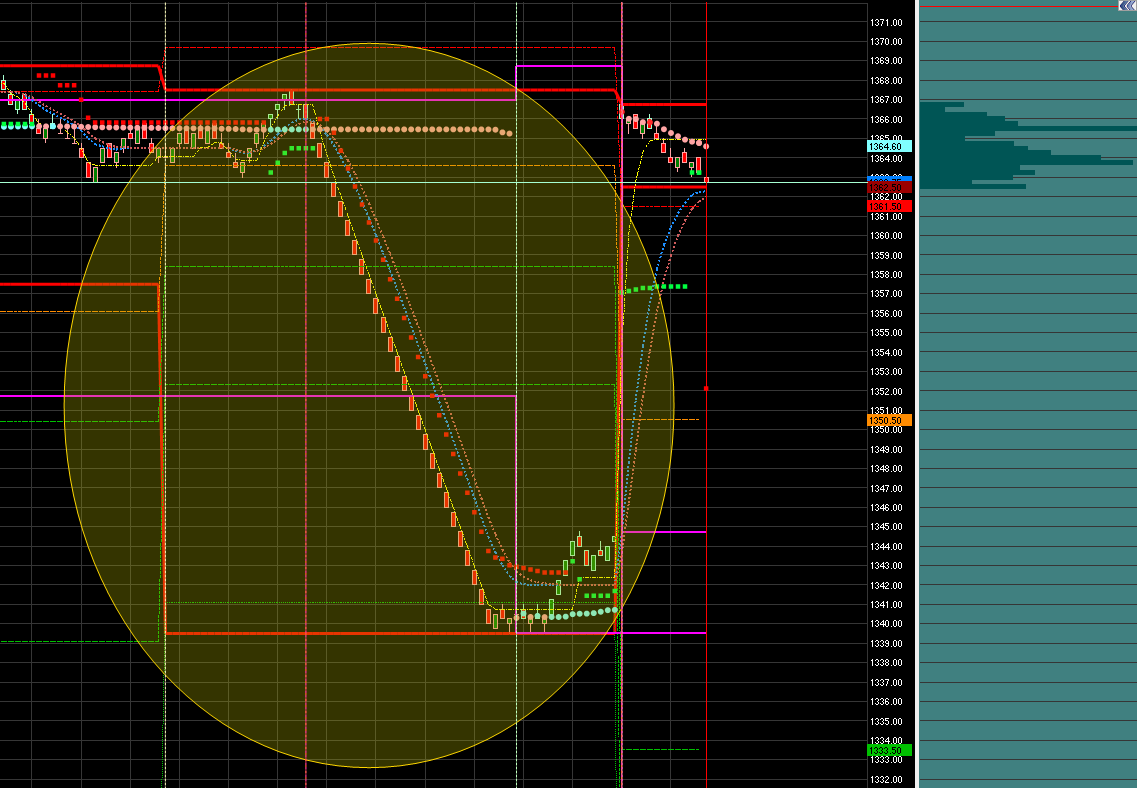
ESM2 charts are showing activities at 19:00 on Friday down to 1339.50 ????
does anyone knows what is going on?
(It is about OEC data for ESM2 I'm mentioning) if you have similar aberration on your chart I'd like to hear from you.
-
I missed it, any recorded link available?
-
Can't get more inspirational than that one.....
-
-
I sympathise, having few TCP connection problems myself and probably have to get it fixed.

-
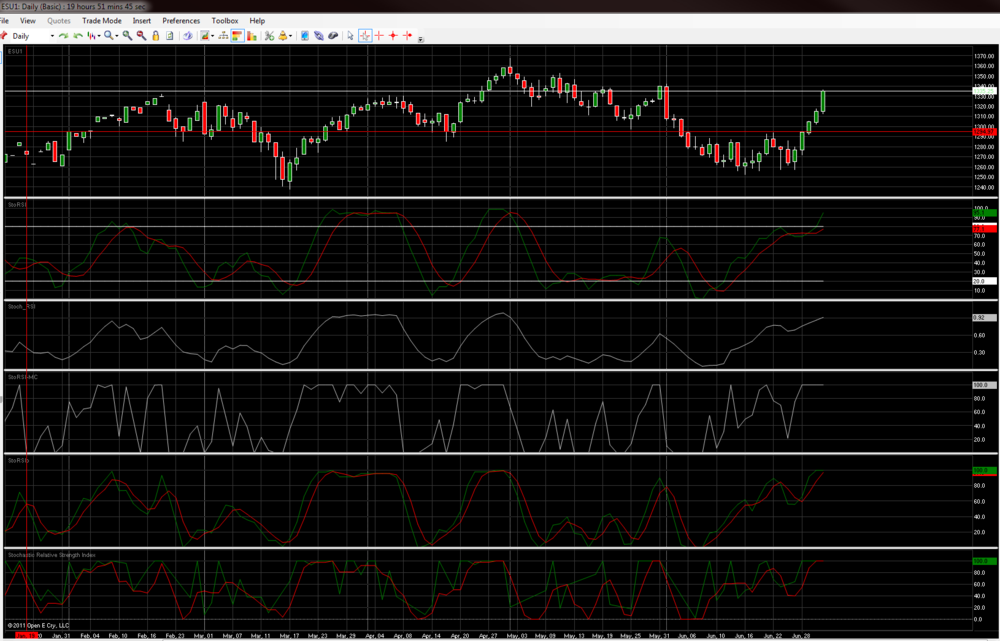
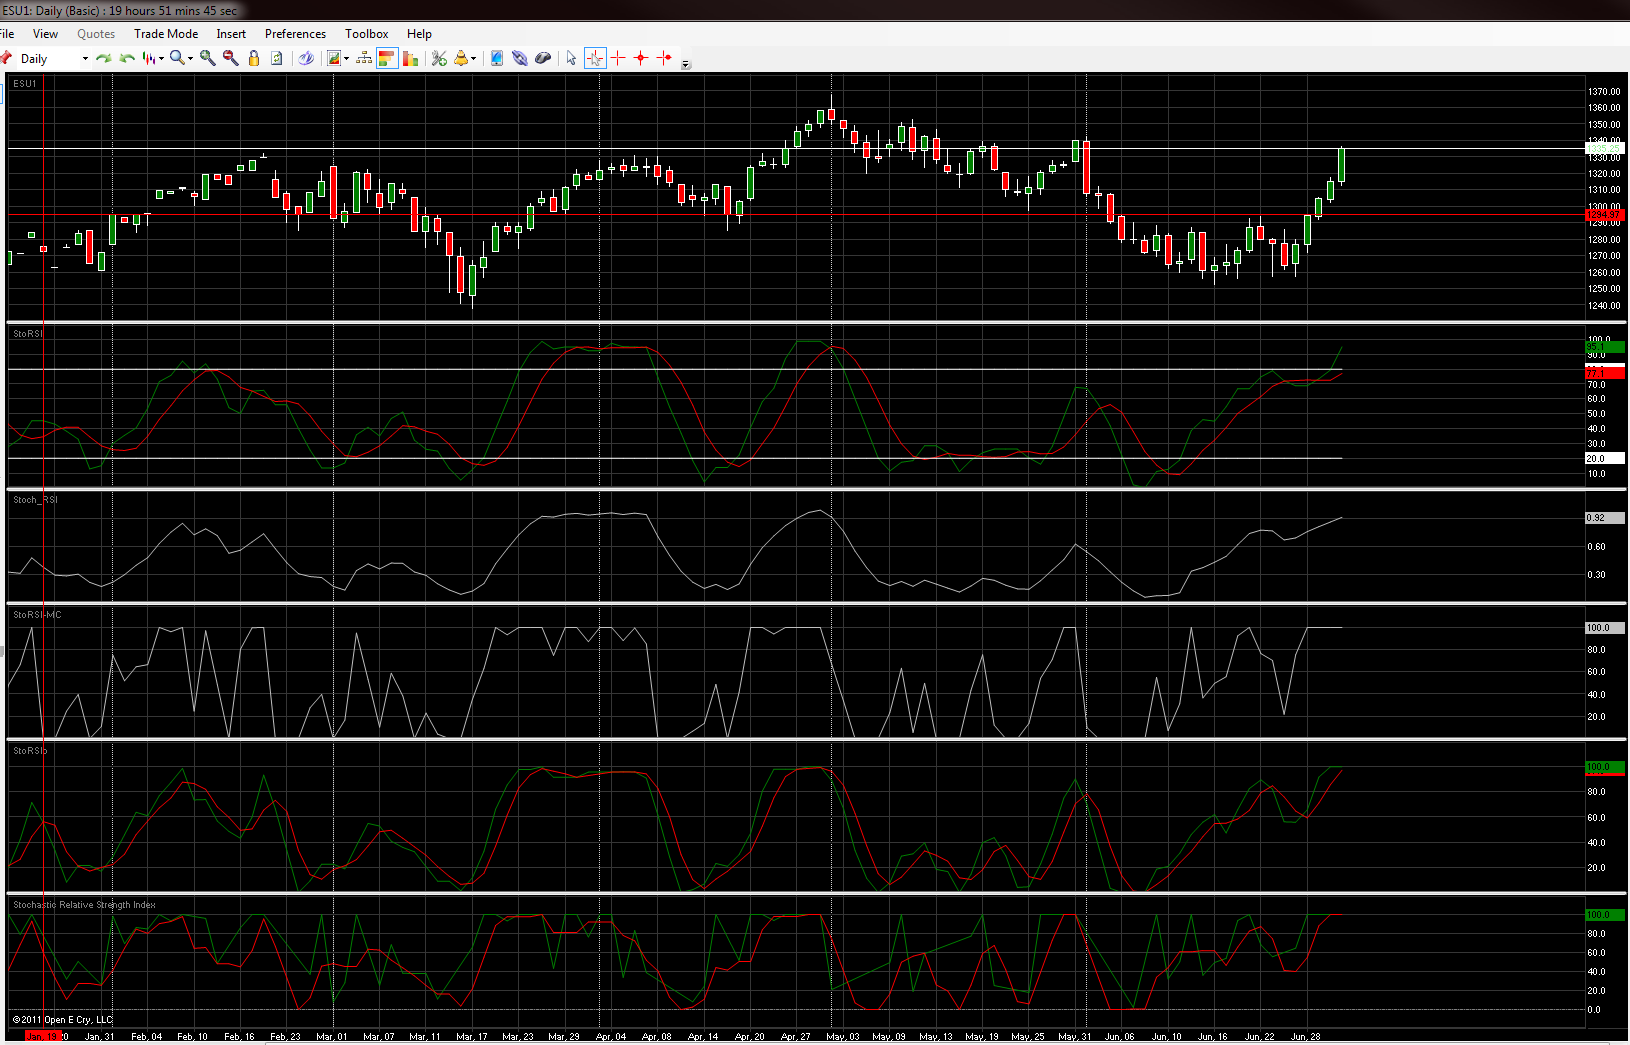
I’m not able to replicate Optiontimer’s StochasticRSI , (using OEC platform).
Can someone post the Easy Language TXT version of the right StochRSI?
So far I’ve tried five different versions none is matching…..
-
-
I'll take all suggestions under advisement, but again, I reserve the final decison for myself.I'd still like to hear from more traderslaboratory.com members about what they would prefer to see traded.
ES, thanks for asking.
-
Did you find the COG easy language version?
Can anyone share it?
-
I’m using a HP Pavilion DV6/i7 Core/4 Gb RAM/15.6”LED monitor. No faults so far.
HP Pavilion dv6-2119TX Notebook - Notebook Computers - HP Compaq - 16 inches - Landmark Computers
I have a 24” monitor connected to the HDMI port, and a 19” monitor through a docking station (Toshiba dynadock).
Toshiba dynadock® V USB Docking Station with Video from Toshiba
Once the HDMI, Docking USB and power supply is disconnected the laptop is free to go.
My external drive, mouse, third monitor and speakers stay connected to the docking station.
The drawback having a powerful system is a short time on the supplied battery ( 1.5 hour) so if you plan to go mobile a bigger battery is required.
.
-
Identifying levels: Overnight high, low,Fib lines on these reference points seem to give good sup/res.
-
Intriguing stuff indeed! where did you find this, in the da Vinci code?
-
Can someone post the easy language indicator.
Thanks
More on Mark Fisher
-
My own quote:
By the time I've defined a trend the reversal has already started…… ;-)
-
Easy as:
Don't sell on a bullish day and don't buy on a bearish day.
In a bullish market buy on dips and in a bearish market sell on rallies.
PS:what a petty I often forget that one!.......
-
I guess the question to be answered is do I have enough time to correct all the useless urban myth that you two have posted?and do I care? I would say the answer is no...So my comment is simply, between the misinformation, the bullshit attitude, and the useless crap....I wouldn't know where to start....
I will be ignoring you completely....I would suggest others do the same...
Just to let you know that I enjoy your posts, keep them coming .
Cheers
-
There is quite a bit of free content on this website but they do offer an Elite version that gives you access to real time quotes, advanced charting, email alerts, and back testing. You definitely want to check out this website.
-
You'll find a lot of materials at:
http://www.ioamt.com/?page=home
Take a 5 day free trail to see if you like this, look at the literature and videos as well.
-
Just following on the post I made about how volume divergences are useful, I made a video of a trade that I took yesterday off the 1181 reistance level in ES. The market traded up to the level on a divergence, then one just needed to read the order flow there to pin point the entry. The video can be viewed here:You'll need to watch it in full screen to see the detail. I should of recorded it in slightly higher quality, which I'll do for my next video. Also what happens at the 1181 resistance level is a great example of a post on the blog called cat whiskers.
Thanks for the videos, can’t hear any voice, it will be valuable to hear your comments.
-
very useful place but the value area you have to imagineDon't have to guess, the values are in the graph, to find the volume at price click on the chart.
(Adobe Flash Player is required)

Heikin Ashi (for OEC)
in Open E Cry
Posted
Thanks, I had a look at it, it is not plotting the Heikin Ashi candles, it just color them. I have the same result with this coding:
{Heikin Ashi PaintBarStudy (not an indicator)
Heikin-Ashi technique for visualization of trend -
Correctly paints bars with no candlesticks if you hide regular bar style as follows:
Format Symbol, style tab, select Dot on Close, color to white or black }
inputs: UpColor(white),DnColor(black);
vars: haClose(0),haOpen(0),haHigh(0),haLow(0), color(0);
if BarNumber = 1 then begin
haOpen = Open;
haClose = (Open+High+Low+Close)/4;
haHigh = MaxList( high, haOpen, haClose);
haLow = MinList( low, haOpen,haClose);
end;
if BarNumber > 1 then begin
haClose = (Open+High+Low+Close)/4; ////average bar price
haOpen = (haOpen [1] + haClose [1])/2 ; ////avg open/close 1 bar ago
haHigh = MaxList(High, haOpen, haClose) ; ////highest of high,open,close
haLow = MinList(Low, haOpen, haClose) ; //// lowest of low, open, close
if haClose > haOpen then color = UpColor
else color = DnColor;
plotPB(haOpen,haClose,"heikin-ashi",color);
SetPlotWidth(1,1);
SetPlotColor(1,color);
end;
Without HA study
With HA Study